
- Friday will see the release of USDA's quarterly Grain Stocks report for stocks on hand as of September 1.
- More often than not, these reports include some newly harvested bushels, skewing what is then used as the ending stocks number for the previous marketing year.
- However, if we were to do away with the silly notion of “marketing years” and view grain supply and demand as a constantly changing system, we have our solution.
Those of you involved in the grain and oilseed markets likely know today, Friday, September 30, will see the release of USDA’s latest quarterly Grain Stocks report at noon (ET). You also likely know these numbers are as of September 1, the beginning of Q2 for the wheat sector (as odd as that has always seemed for spring wheat) and the beginning of a new marketing year for corn and soybeans. Given the latter, these numbers are viewed as the de facto ending stocks figures for the two most talked about crops in the US. This is one of the inherent problems with these reports used for anything meaningful because invariably some newly harvested bushels are added into old-crop stocks. It’s just the way it works, something we have to accept as fact, but yet obviously skewing what is believed to be the previous marketing year’s ending stocks number.
In the grand scheme of things, does any of this matter? No. As you know I don’t use USDA’s imaginary numbers for fundamental information but rather entertainment, as in comic relief from tracking market movements. But a lot of folks take the numbers very seriously, some building entire careers with the sole purpose of telling everyone else just how important every number created and released by the government is, even if the premise isn’t true. The vast majority of the industry refuses to believe markets can actually work without government control, though also refuse to admit the socialistic thought behind such a belief.
Let’s set all that aside for a discussion another day, for like it or not there will be quarterly grains stocks numbers released today. We can still ask the question if there is a better way, though, and to that my answer is a resounding “Yes”.
If I were King of the US (a scary proposition, I know), and the system could only function with endless, meaningless reports released over the course of the year, one of the first changes I would make would be to eliminate marketing years. If we stop and think about it, the only purpose marketing years for grains serve is they allow folks to keep score. And for some reason that has always been important, regardless of industry. But what if we thought of available grain stocks as a constantly flowing system rather than something with a porous beginning and imaginary end?
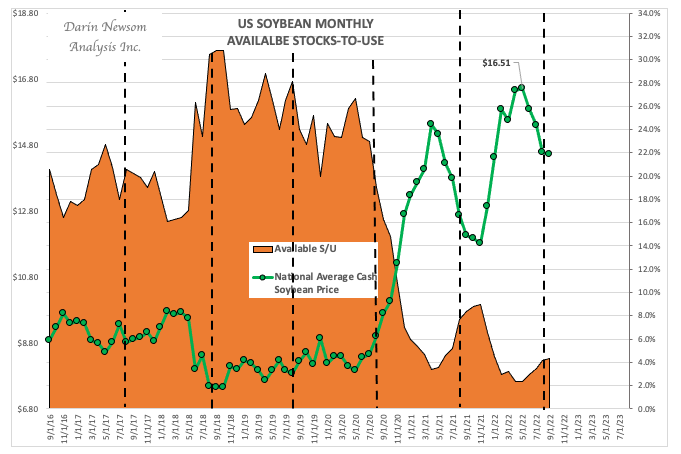
I already do this in my analysis, using the Barchart National Price Indexes to tell me what the available stocks-to-use situation is for the five major grains any day of the month. This is easier than one would think as long as there is a willingness to concede the relationship between a market’s intrinsic value (cash price) and supply and demand. If you stop and think about that last sentence, isn’t that what economics is all about? Changes in supply and demand are supposed to relate to changes in price. Yet USDA followers, many calling themselves “economists”, have always been more than willing to set this basic notion aside.
Taking cash prices at the end of every month, my studies show nearly 100% correlation between cash and available stocks-to-use, the latter being the most important fundamental calculation as it includes both supply and demand. The tricky part is it requires me to use the Unknown Variable Solution since we don’t know the actual supply or demand numbers, but we do know cash price. Given this, I can’t tell you what total supplies are, or total demand, or what ending stocks may be, but I can tell you what the relationship is between available stocks and demand. And in the end, that’s really all that matters.
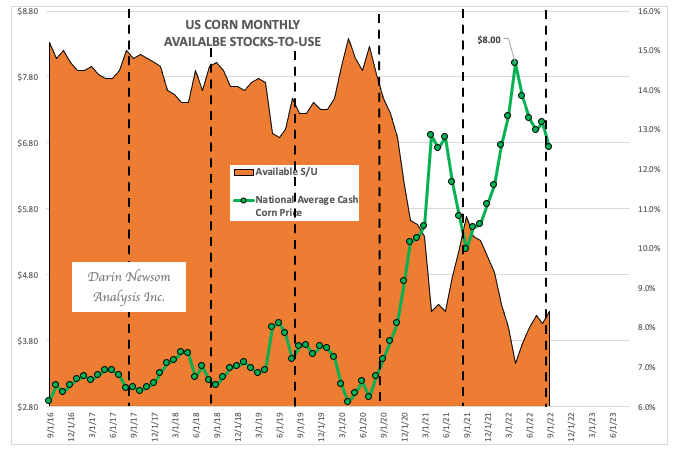
Let’s take a look back at the end of August for corn and soybeans. Based on corn’s cash price of $7.11, the end of month available stocks-to-use was 8.1%. I don’t call this ending stocks-to-use because we know harvest was going on in different parts of the US bringing new supplies into the system. As for soybeans, August ended with an average cash price of $14.57 correlating to an available stocks-to-use figure of 4.2%. Here we can see the effects of a slowdown in demand over Q4 as available stocks-to-use climbed from 2.5% at the end of May.
More Grain News from Barchart
/AI%20(artificial%20intelligence)/AI%20technology%20concept%20by%20NMStudio789%20via%20Shutterstock.jpg)