- All three major US stock indexes were able to post solid rallies Wednesday, though in the grand scheme of things the move didn't do much to change the trends on long-term monthly charts.
- The Nasdaq has already seen a Dow Theory 33% retracement level from its all-time high, one reason the argument has been made it might've turned a bullish corner.
- However, both the S&P 500 and DJIA have time and space to work lower given major downtrends tend to last 18 months or so.
It has been quite a month this week for US stock indexes, with the most common question being have the three major markets finally bottomed. If you want an answer in the affirmative, all you have to do is tune into one of the financial news channels this morning, the day after solid rallies were posted by the Dow Jones Industrial Average (1.9%), the S&P 500 (2.0%), and the Nasdaq (2.1%). After all, these media outlets are filled with “analysts and commentators” who have proclaimed the next bull market every time the indexes have posted a higher daily close, only to be chased back into the shadows when the bears came back.
While this has been as entertaining as the old Roman spectacle of watching whoever happened to find themselves on the Colosseum floor versus the Lions (and no, not the tame ones from Detroit), the reality is from a technical point of view the three major us stock indexes could indeed be near a bullish turning point. I know, I heard the gasp that came from the crowd as I hinted I might me joining the squawking throng, but let’s take a closer look at the long-term monthly charts and you’ll better understand what I see.
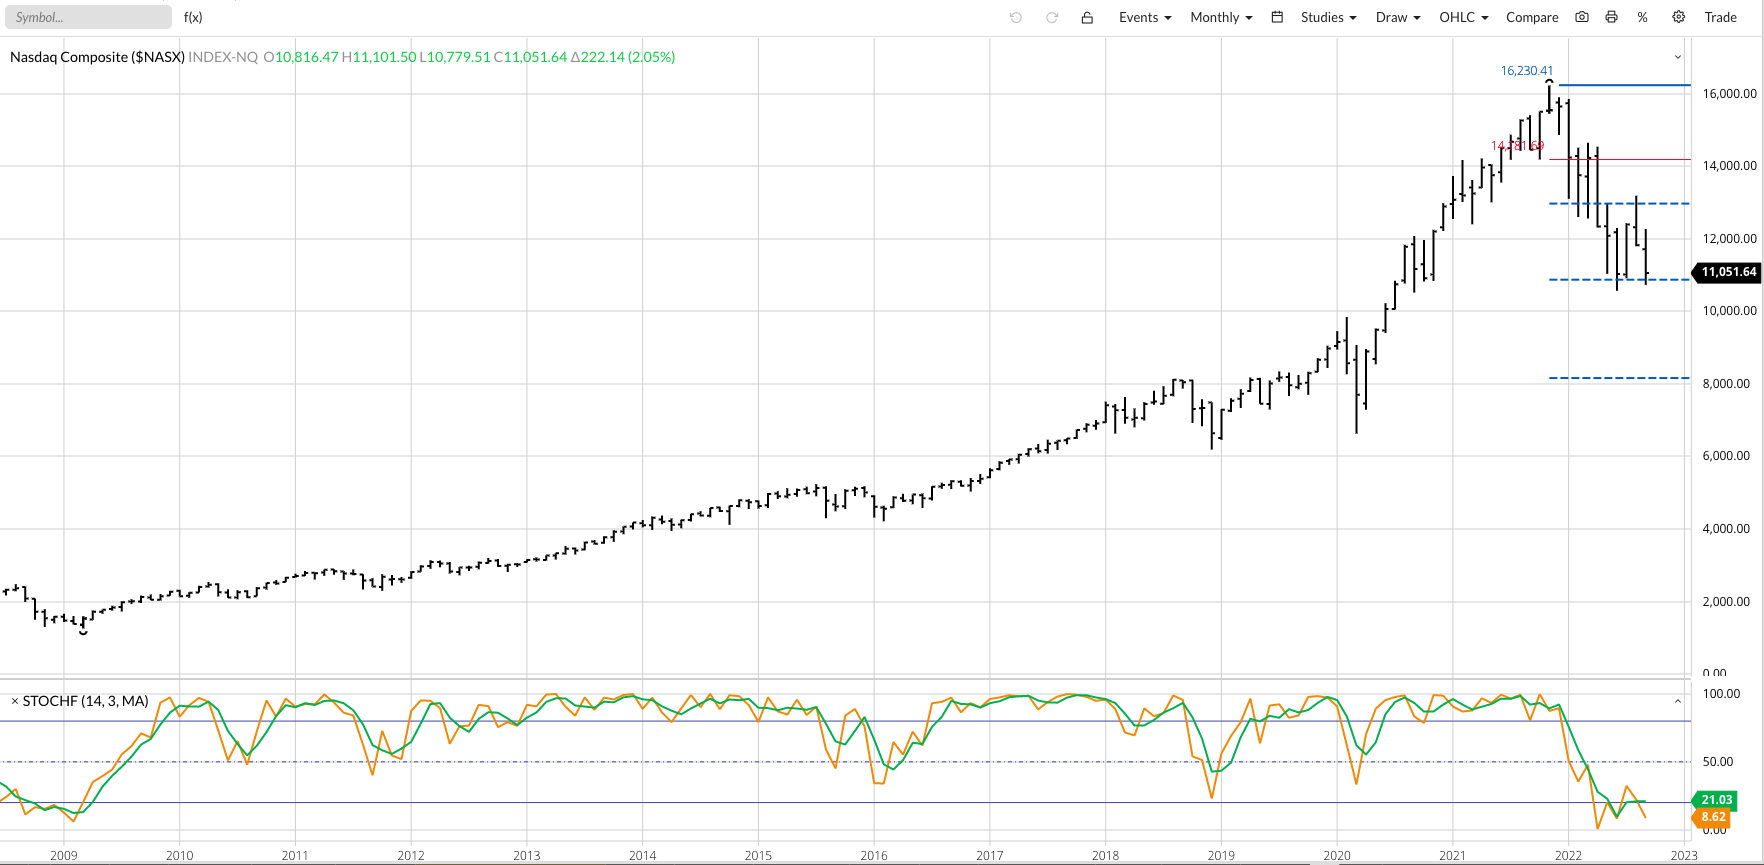
Recall from one of my most recent pieces on the matter of long-term trends, regarding the Nasdaq ($NASX) I said, “..it could be argued the index completed a bullish 2-month reversal pattern on its monthly chart, indicating its major trend has turned up.” The index’s monthly chart shows the June low of 10,565.14 continues to hold, with the Nasdaq hitting a low of 10,737.72 so far this month. Given this, the idea the index is in Wave 2 of a major 5-wave uptrend pattern still holds. It’s also interesting to note the Nasdaq has seemingly found support near its Dow Theory 33% retracement level of 10,874.37 (middle dashed blue line) and has not posted a monthly close below that mark. At least not yet.
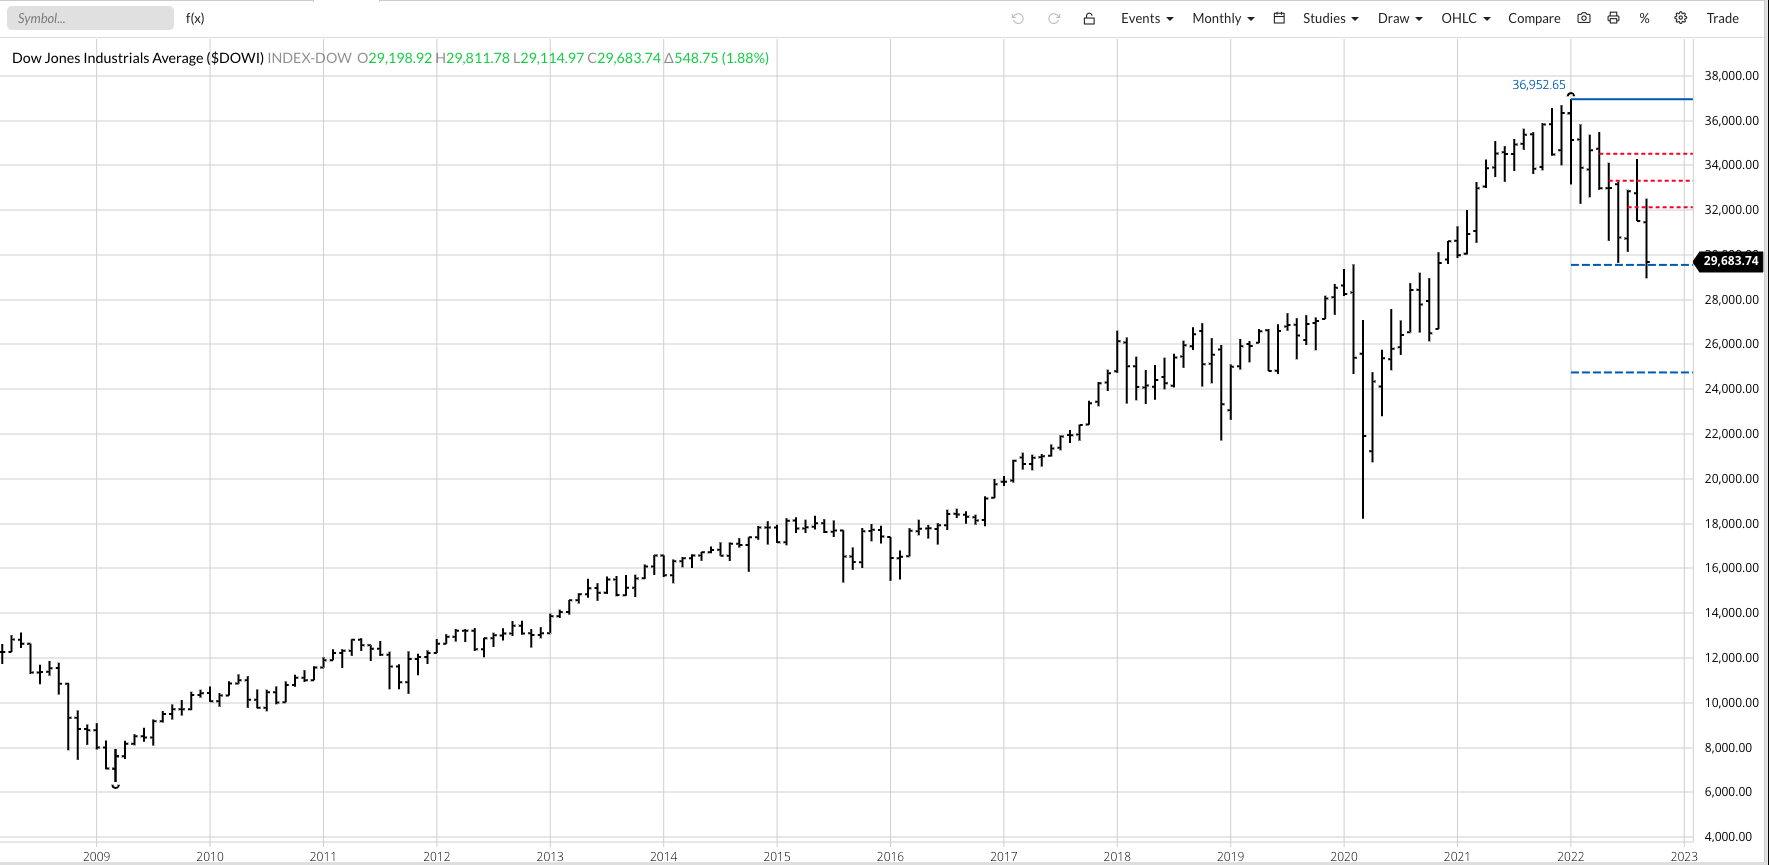
The monthly chart for the DJIA ($DOWI) still looks a bit ominous to me. However, for those wanting to be bullish it can now be said the index has taken out its June low of 29,653.29, technically completing its long-term 3-wave downtrend pattern. Wave A (first wave) ran from the January 2022 high of 36,952.65 through the June low, with Wave B (second wave) peaking at 34,281.96 as part of the bearish spike reversal during August. Despite Wednesday’s rally, some would call it a “Dead Cat Bounce” following Tuesday’s meltdown, all eyes will be on the DJIA as it flirts with a monthly close below its 20% retracement mark of 29,562.12 (top dashed blue line) as September comes to an end, as the 20% level is a historic indicator of a bearish market. There is evidence that bear markets, aka long-term downtrends, tend to last 18 months meaning the DJIA has time and space to reach its own 33% retracement level of 24,758.28 by next June if it so chooses.
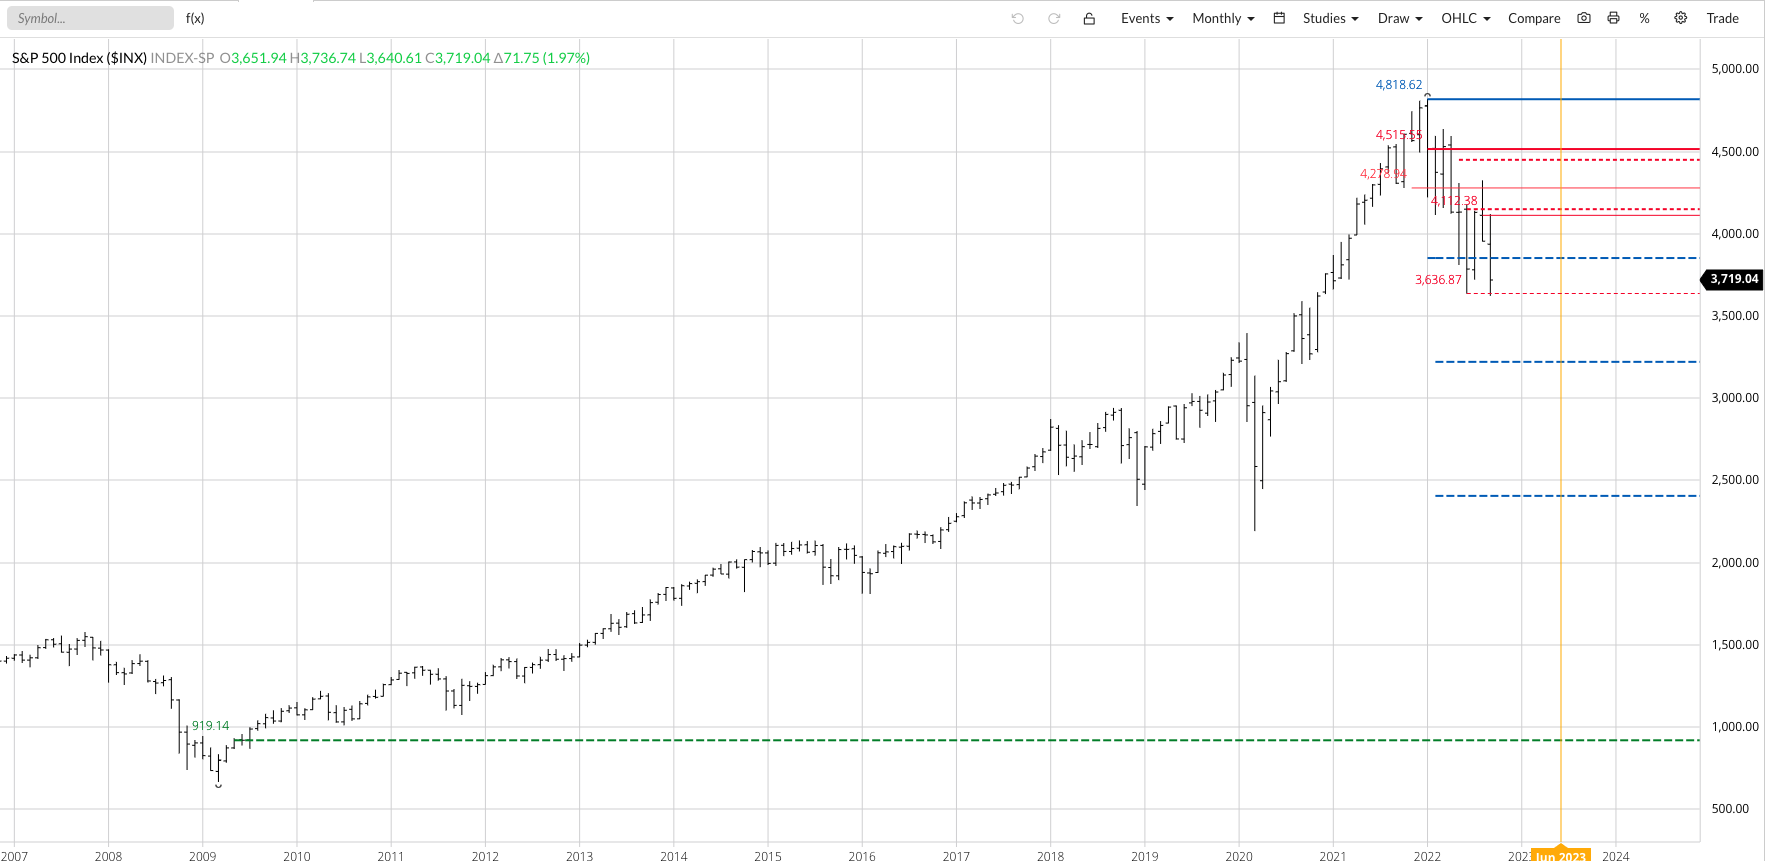
It’s a similar story for the S&P 500 ($INX) as it took out its Wave A low from this past June of 3,636.87 this week. Again, it could technically be argued the 3-wave downtrend pattern has been completed, but I don’t see a bullish reversal pattern forming at this time. Also note the index has consistently held below its 20% retracement mark of 3,854.90 with the 33% retracement level of 3,228.48 still on the horizon. I will say this for the S&P though, after doing some digging I found an article talking about how the index’s P/E ratio has fallen back enough for it to be considered Fairly Valued. If so, it could be difficult for investors to continue to sell every rally unless they remain convinced the path of least resistance is one of liquidating equities and buying the US dollar ($DXY).
The bottom line remains the same: Until I see some type of reversal pattern in the DJIA and S&P 500, long-term trends remain down. This will likely weigh on the Nasdaq, erasing its early ideas of a bullish turn. Now, let's see how the end of the month plays out.
More Stock Market News from Barchart


/Micron%20Technology%20Inc_%20logo%20on%20building-by%20vzphotos%20vis%20iStock.jpg)

/AI%20(artificial%20intelligence)/AI%20engineer%20working%20on%20laptop%20by%20ART%20STOCK%20CREATIVE%20via%20Shutterstock.jpg)