
The charts are key to this analysis.
Gold
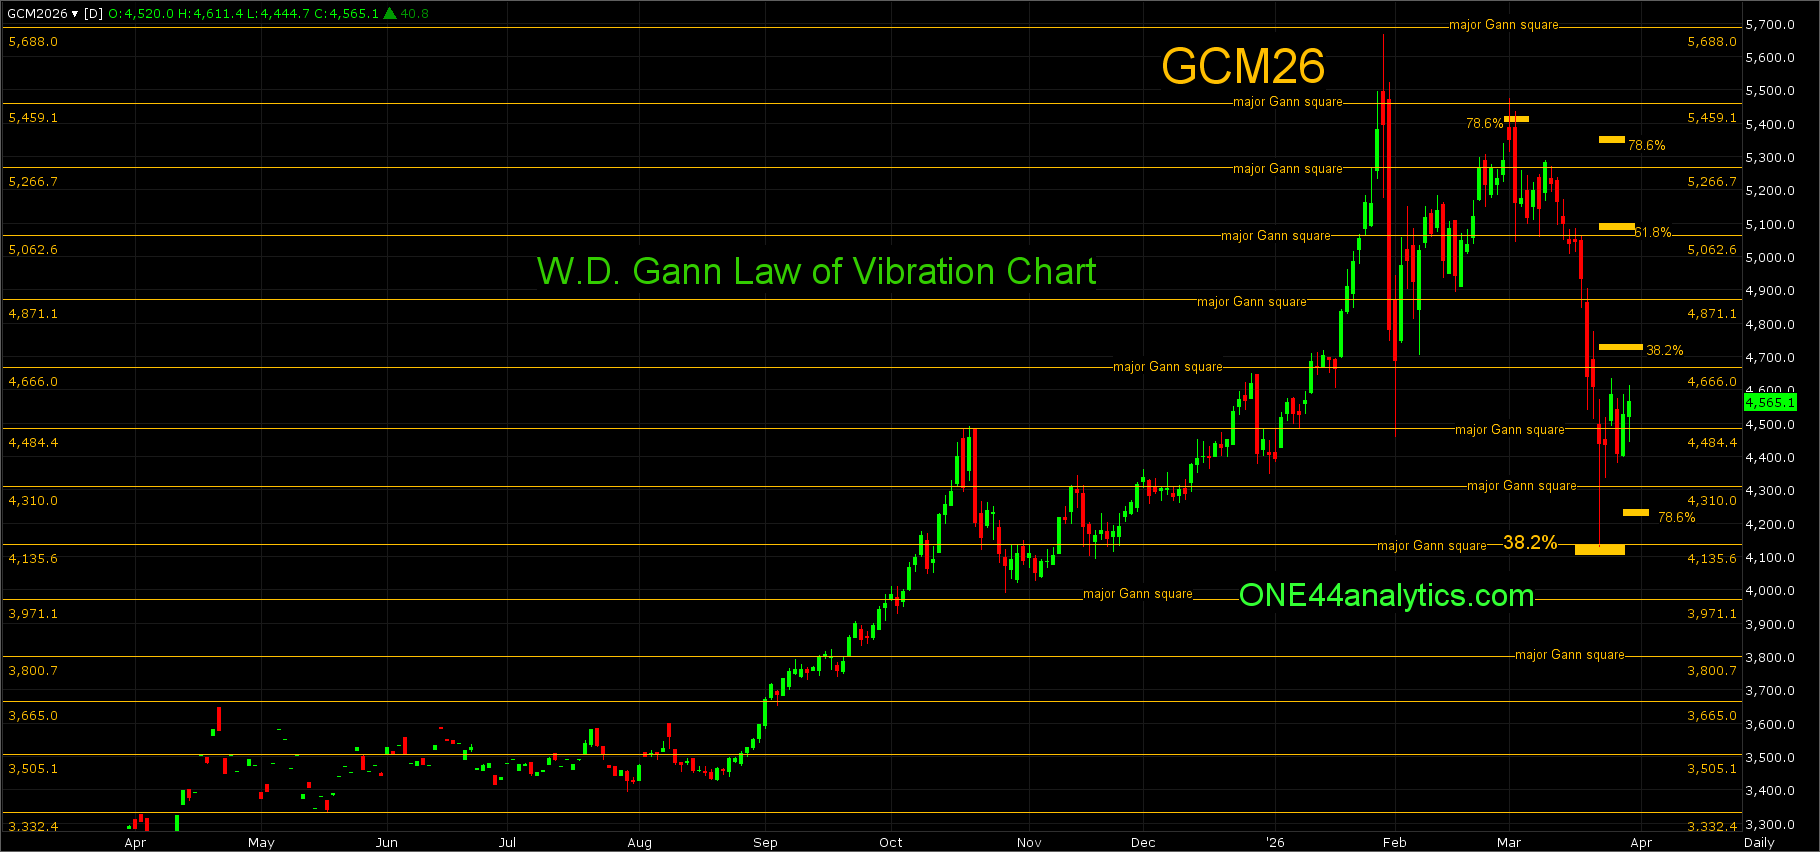
From last week in the April contract,
Use 4644.00 as the swing point for the week.
Below it, The short term target is the 4303.00 major Gann square. The long term target is also the long term swing point at 4119.00, this is 38.2% back to the 2022 low and a major Gann square.
It has already rallied over $400 from this level and 38.2% back to the ATH at 4685.00 will be the short term target.
June The June contract also hit 38.2% back to the 2022 low on 3/23/26 at 4135.00, this was also a major Gann square. The key level for the week will be 38.2% back to the high on 1/29/26 at 4722.00, if this is all it can rally coming from a much longer term 38.2% level it would be a negative sign and a new low can quickly follow.
Use 4722.00 as the swing point for the week.
Above it, the short term target area is the 5062.60 major Gann square and 61.8% back to the contract high at 5082.00. The longer term target is 78.6% of the same move at 5345.00. The long term target after holding 38.2% back to the 2022 low is a new high per the ONE44 38.2% rule.
Below it, the short term target is 78.6% back to the 3/23/26 low at 4245.00. The long term target on a failure to hold 38.2% back to the 2022 low at 4135.00 will be 61.8% of the same move at 3210.00. Before then there are major Gann squares to look for support and then use as the swing point when closed below, they are on the chart.
SP 500 Futures
From last week,
In the SP 500 Futures we said,
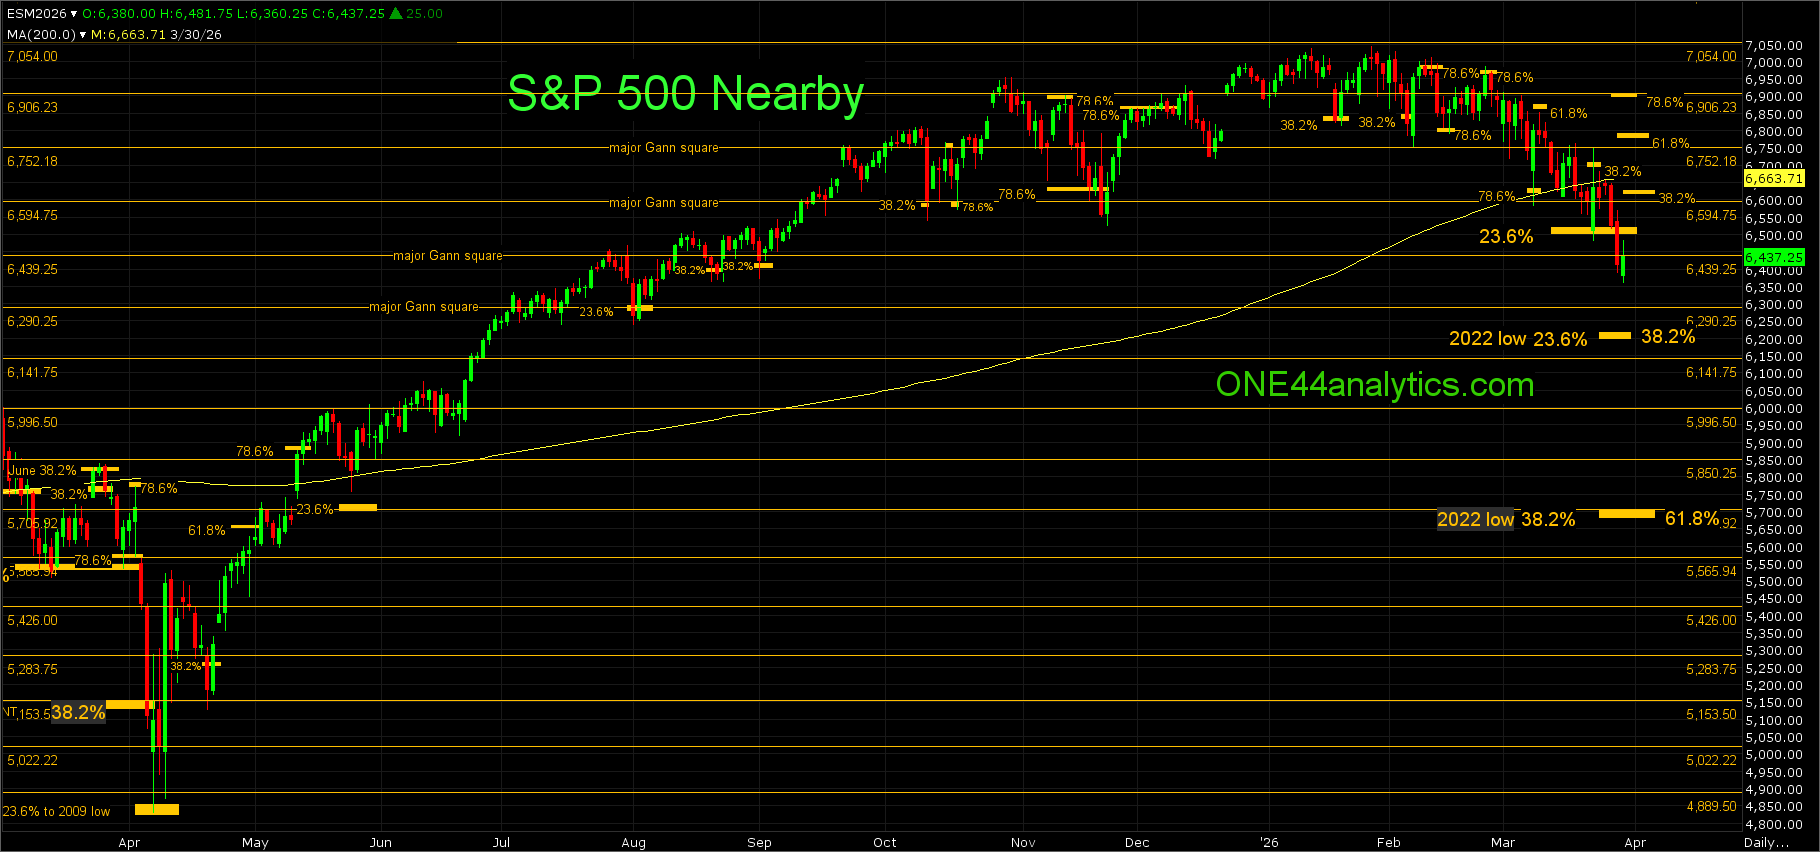
The initial move down on 3/9/26 sent the market right into the short term target area of 6636.00 to 6594.00, this is 78.6% back to the 11/21/25 low, the 200 day average (6608.00) and the 6594.00 major Gann square, what followed was a massive 250 point rally in a day and a half. That rally fell short of 61.8% at 6865.00 and then went right back into the short term target area. Friday's low was $3 short of the longer term target at 6520.00 and this will be the key level for the week. The late Friday rally from this area was $65, however with the volatility that the market has been having it could still trade well below and close above it to say the level held. With the current low it will need to get back above the 200 day average at 6647.00 to give the first indication this make is done going down for now. The second would be taking out the 38.2% retracement back to the ATH.
Use 6520.00 as the swing point for the week.
Overnight the market traded below 6520.00 and the rally after getting back above it has already hit the new 38.2% back to the ATH at 6700.00, this will be the key level for the week now.
The rally from 23.6% at 6520.00 could not get a close above 38.2% at 6700.00, or the 200 day average keeping this leg down negative and it went on to a new low as this is the target when it fails to take out a 38.2% (6700.00) retracement, per the ONE44 38.2% rule. With the new low the key level for the week will be 6520.00, this is both the long term 23.6% retracement to the 4/7/25 low and is now is 23.6% back to the ATH making it an important level to get back above.
Use 6520.00 as the swing point for the week.
Above it, the short term target is 38.2% back to the ATH at 6620.00, a failure to get above this level keeps the short term trend negative and a new low can quickly follow. The longer term target is 61.8% of the same move at 6783.00. The long term target area is 78.6% at 69.00 and the 6906.00 major Gann square.
Below it, the short term target is the longer term swing point of 6220.00, this is 38.2% back to the 4/7/25 low and 23.6% back to the 2022 low, a failure to hold this area will give us a long term target and swing point at 5706.00, this a major Gann square, 61.8% back to the 4/7/25 low and 38.2% back to the 2022 low. Before that there are major Gann squares to look for support and then use as the swing point when closed below, these levels are on the chart.
You Can sign up here for free updates for Gold & SP 500 Futures.
ONE44 Analytics where the analysis is concise and to the point
Our goal is to not only give you actionable information, but to help you understand why we think this is happening based on pure price analysis with Fibonacci retracements, that we believe are the underlying structure of all markets and Gann squares.
If you like this type of analysis and trade the Grain/Livestock futures you can become a Premium Member.
You can also follow us on YouTube for more examples of how to use the Fibonacci retracements with the ONE44 rules and guidelines.
FULL RISK DISCLOSURE: Futures trading contains substantial risk and is not for every investor. An investor could potentially lose all or more than the initial investment. Commission Rule 4.41(b)(1)(I) hypothetical or simulated performance results have certain inherent limitations. Unlike an actual performance record, simulated results do not represent actual trading. Also, since the trades have not actually been executed, the results may have under- or over-compensated for the impact, if any, of certain market factors, such as lack of liquidity. Simulated trading programs in general are also subject to the fact that they are designed with the benefit of hindsight. No representation is being made that any account will or is likely to achieve profits or losses similar to those shown. Past performance is not necessarily indicative of future results.
/Micron%20Technology%20Inc_billboard-by%20Poetra_RH%20via%20Shutterstock.jpg)

/Netflix%20open%20on%20tablet%20by%20rswebsols%20via%20Pixabay.jpg)
/Tesla%20Inc%20logo%20by-%20baileystock%20via%20iStock(1).jpg)