
Electronic trading has changed the landscape of trading today. Before electronic trading, futures trading was done in trading pits at different futures exchanges worldwide. These pits existed to facilitate futures contract transactions in a central location.
During this era, there were two types of traders: Floor traders and off-floor traders. Floor traders were responsible for making markets for the off-floor traders. Floor traders stood in crowded pits, sometimes shoulder to shoulder, and had to gauge market moves by reading the order flow. Off-floor traders could do more extensive studies before sending their orders. Off-floor traders' orders were also known as "paper."
Floor traders often found themselves at a disadvantage in making a market because they couldn't see the same support/resistance levels that off-floor traders could see. Before the '80s, a floor trader in the Wheat pit developed a formula that could give a trader an idea of where to expect support/resistance levels for the next trading session. These levels were called Floor Trader Pivots.
Floor Trader Pivots
The simplicity of these pivot numbers is that they are price-based on a prior session's high, low, and closing prices and remain static throughout the next trading session. During the pit trading years, traders widely followed these pivot numbers. Now that we're trading electronically, pivot numbers are embedded in most charting packages and widely followed by professional and non-professional traders. For centuries human nature has reacted to greed, fear, hope, and the unknown. Due to this tendency, traders will respond to basic chart levels repeatedly. Pivots worked well for floor traders for many years, standing the ultimate test of time, and will continue working in the current electronic trading environment.
Pivot numbers are popular among day traders by calculating pivots from daily price ranges, but swing traders can use them using last week's price range to calculate the numbers. Today, computers will automatically calculate and plot these numbers on your charts. Barchart publishes a daily Traders Cheat sheet listing the day's floor trader pivot numbers for the current session concerning the high, low, and last prices.
Since the traditional floor trader pivots were created, numerous other versions have been created. We will focus on the original formula as these are the most popular.
Calculations for the floor trader pivots
At the core of this formula is the pivot point itself. The pivot point is a weighted average of the prior sessions range. By averaging the high, low, and close together, we are giving more weight to where the market closed. Many traders agree that the close is a significant price for the day. Therefore, the pivot point is an average price of where the average buyer and seller traded in the prior session.
During the next session, price trading above the pivot point is considered bullish, and price trading under the pivot point is considered bearish.
There are four additional lines of support/resistance in the formula—two resistance (R) lines above the pivot point and two support (S) lines under the pivot point.
R2 = Pivot Point + (High - Low)
R1 =2 * (Pivot Point – Low)
Pivot Point = (High + Low + Close)/3
S1 = 2 * (Pivot Point – High)
S2 = Pivot Point – (High – Low)
Significance of Support/Resistance levels
Understanding technical (charting) and mathematical support/resistance, along with trends, is beneficial for traders. They allow traders to see potential turning points in the current price trend.
When price approaches support or resistance levels, there are two potential outcomes:
- The trend will begin to reverse if the price cannot trade through support/resistance.
- If the price trades through support/resistance, it will resume the previous trend. If the price had been at resistance and traded through it, that resistance area would now become support. Reverse for trading through support, that support area would now become resistance.
The trader must have rules in their trading plan for what "trades through" looks like to them.
Along with using floor trader pivots as areas of support/resistance for entering a trade, they can also be used for logical profit targets.
Why you, as a trader, may want to use floor trader pivots
- Quantifiable – Due to the formula's simplicity using recent price action, they are considered an ideal tool for finding entry and exit points.
- Data recency – All you need is high, low, and close prices for the prior session—no need to have months and years of historical data.
- Proven over time – Floor trader pivots have survived the test of time. They're as accurate today as they were when they were designed.
- Comparable results across differing assets – A study that works across various assets including, Forex, Futures, and Stocks.
Let's view some charts with the floor trader pivots applied.
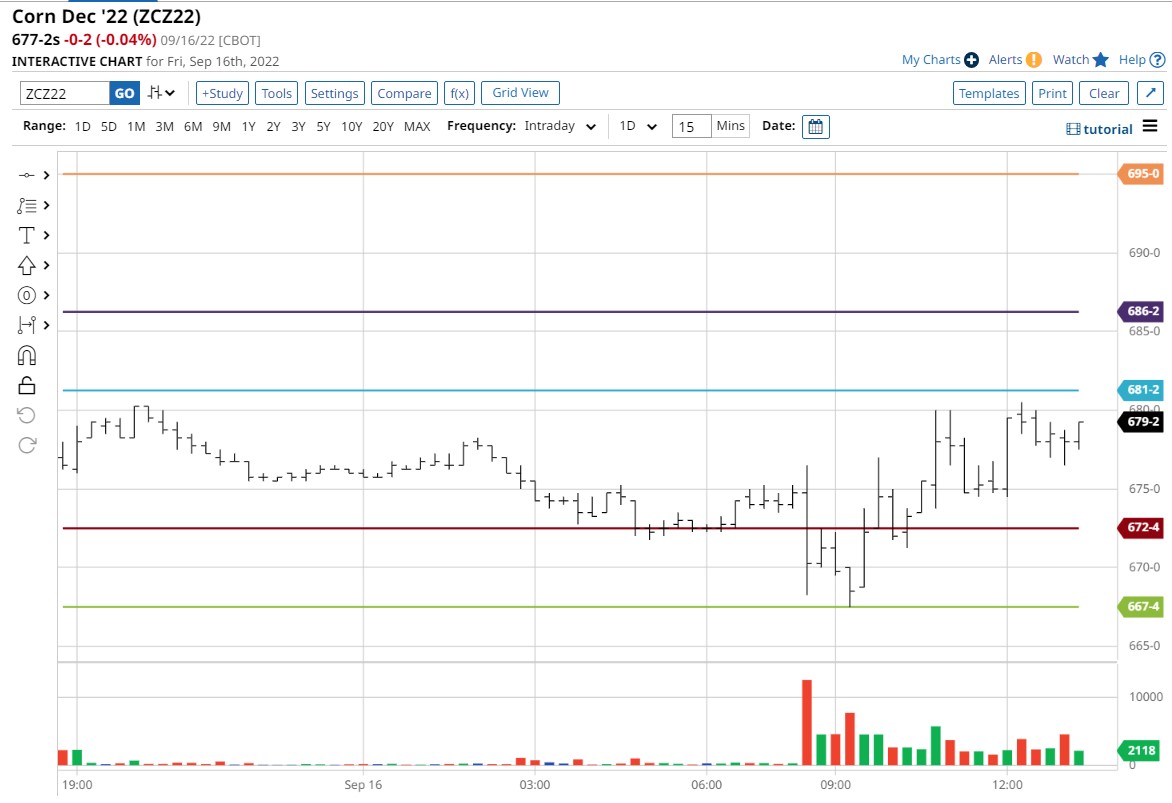
The above intra-day 30-minute corn chart illustrates an entire session of trading. The colored horizontal lines are floor trader pivots; the blue middle line is the pivot point. Above the pivot point are two resistance lines, and below the pivot point are two support lines. I included the volume figures at the bottom of the chart to illustrate when the regular trading hours (RTH) are for corn. The RTH session is the most liquid time of the day and the most likely time you will be day trading. We'll use this format to analyze other charts below.
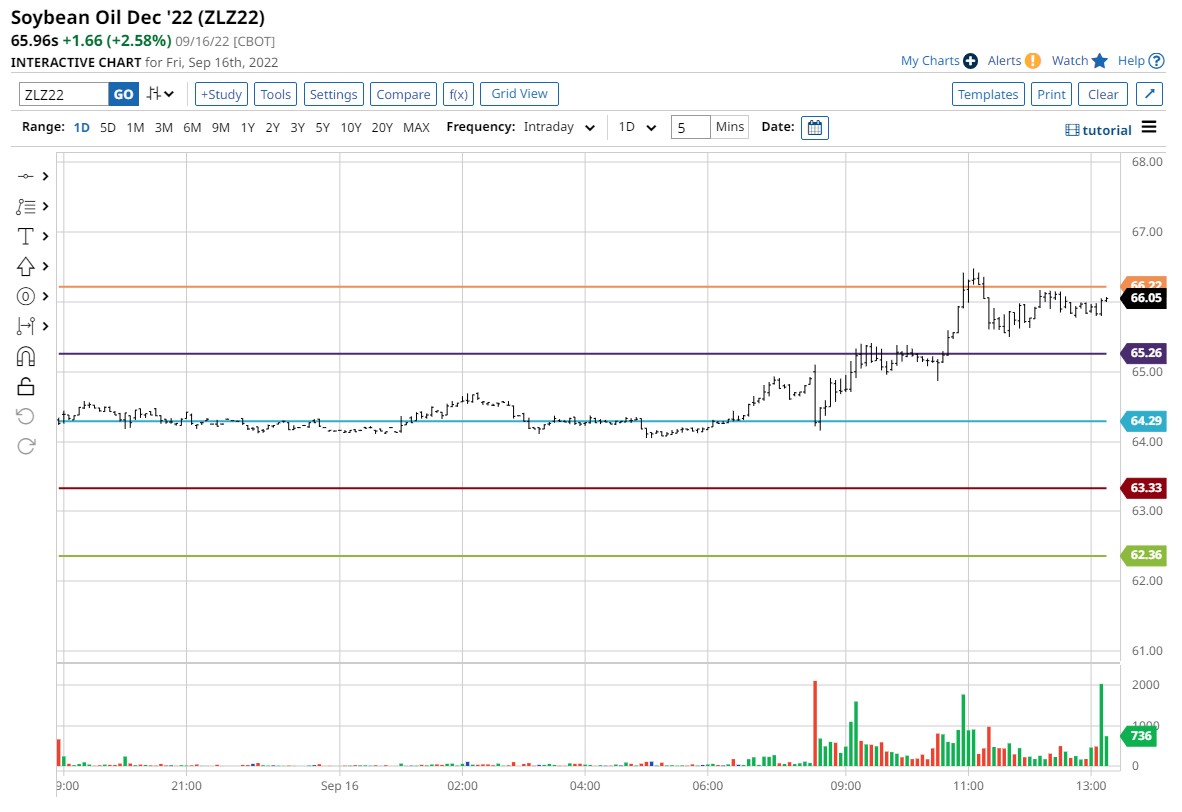
Soybean Oil for December shows the RTH (start of high volume bars) session open. Price dropped to the pivot point and found support. Price then rallied up to R1 (the following line above the pivot point) and met resistance. R1 caused sideways trading before breaking out into new highs above R1 and continued until it met resistance at R2, where the session high was made.
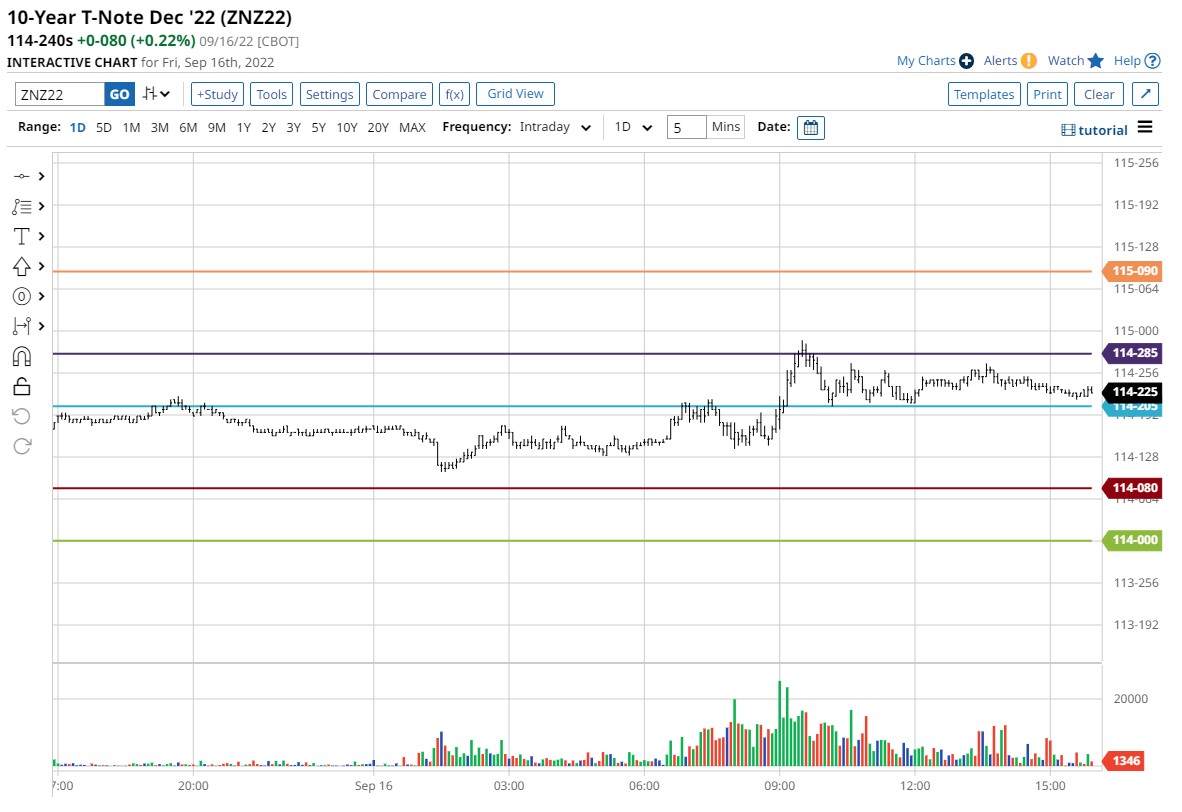
The 10-Year T-Note for December opened the RTH session at 07:20 CT and immediately found resistance at the pivot point. The sellers could not keep the price under the pivot point, and soon price broke out above it. After the breakout, the price continued until it met resistance at R1. The sellers could push the price back down to the pivot point, where the market found support. The buyers spent the rest of the session keeping price above the pivot point but could not reach R1.
In Summary
The floor trader pivots assist the trader in finding potential turning points in the markets they are trading. No analysis technique always works, but from the illustrations I have shown you, I hope you can see how support/resistance reverses roles once the price has traded through it.
If you're a trader looking to design a trading plan, your next step is understanding the trend. Combining trends with floor trader pivots is a logical next step. Create your own rules and risk management, and backtest your strategy before risking capital.
More Education News from Barchart
/NVIDIA%20Corp%20logo%20on%20phone-by%20Evolf%20via%20Shutterstock.jpg)
/Micron%20Technology%20Inc_%20logo%20on%20building-by%20vzphotos%20vis%20iStock.jpg)
/A%20Palantir%20office%20building%20in%20Tokyo_%20Image%20by%20Hiroshi-Mori-Stock%20via%20Shutterstock_.jpg)

/Semiconductor%20chip%20by%20Mykola%20Pokhodzhay%20via%20iStock.jpg)