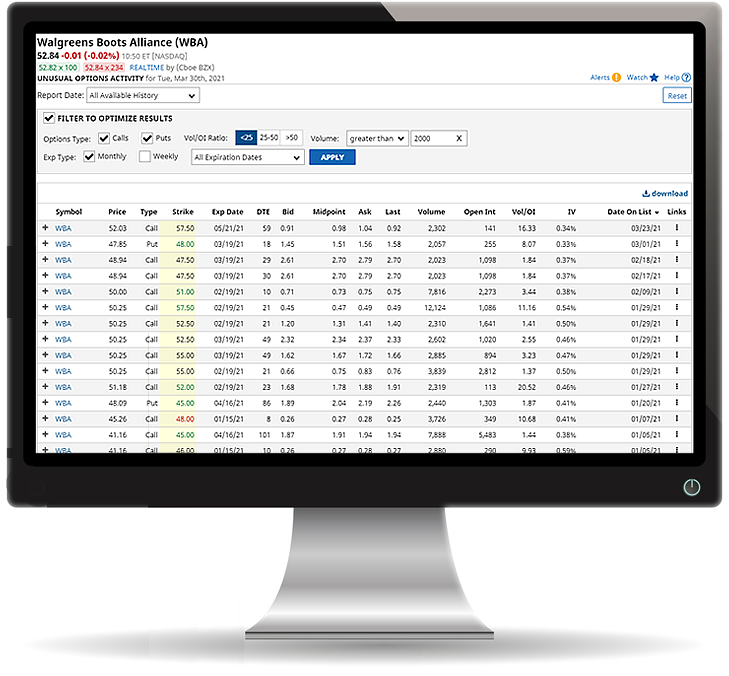
Options with unusual activity highlight puts and calls for stocks that have a high volume-to-open interest ratio. The volume for the underlying equity gives an indication of the strength of the current market direction, while the open interest for the put or call tells you the number of option contracts that are currently "open" (not yet liquidated). When there is a high ratio of underlying volume-to-option open interest, this may be an indication that the options are more "liquid" and that they may be easier to enter or exit a trade.
Additional Report Date and data filtering options are available for Premier Members, along with the ability to download the data on the page to a .csv file.
What's Included (Latest Date - Unusual Options Activity)
The page defaults to show all options trades with volume greater than 10 for today (whether "unusual" in nature or not).
The Strike Price column will also give you additional information, based on the last traded price.
- Bullish - If a call trades at or above the ask/offer, or a put trades at or below the bid, a bullish sentiment would be attached to the trade and the Strike price is displayed in green.
- Bearish - If a call trades at or below the bid or a put trades at or above the ask/offer, a bearish sentiment flag would be attached to the trade and the Strike price is displayed in red.
The page starts updating for the new trading day at approximately 9:50a.m. ET. Options information is delayed approximately 25 to 30 minutes, and is updated approximately every 5-minutes through-out the trading day.
Note: Expired options are removed from the website Monday - Friday at 7:45pm ET.
Historical Reports & Page Filtering
Premier Members can view a specific historical page date by choosing a date from the Historical date picker. This will show you the unusual options data for the symbol as of the chosen date. Historical Unusual Options Activity reports go back to 05/14/2020.
When viewing history for a specific date, the report additionally shows a chart icon to the right of the symbol that allows you to view a chart of the underlying asset. The chart is a 7-day intraday candlestick (close-to-close) that starts on the day of the historical report you are viewing. The chart is provided to show whether the unusual options activity affected the underlying stock's price in the week after the activity occurred.
On-page filtering is available for either today's report or any historical date you select. Additional filter options include:
- Volume/Open Interest Ratio - greater than, less than, or between specific values
- Volume - greater than, less than, or between specific values
- Delta - greater than, less than, or between specific values
- Options Type - view either Puts or Calls
- Expiration Type - view either Monthly or Weekly expirations
- Expiration Date - select a specific expiration date, or exclude options expiring after a specific expiration date
Data Updates
For pages showing Intraday views, we use the current session's data with new price data appear on the page as indicated by a "flash." Stocks: 15 minute delay (Cboe BZX data for U.S. equities is real-time), ET. Volume reflects consolidated markets. Futures and Forex: 10 or 15 minute delay, CT.
The list of symbols included on the page is updated every 10 minutes throughout the trading day. However, new stocks are not automatically added to or re-ranked on the page until the site performs its 10-minute update.
For reference, we include the date and timestamp of when the list was last updated at the top right of the page.
Page Sort
Pages are initially sorted in a specific order (depending on the data presented). You can re-sort the page by clicking on any of the column headings in the table.
Views
Most data tables can be analyzed using "Views." A View simply presents the symbols on the page with a different set of columns. Site members can also display the page using Custom Views.
Each View has a "Links" column on the far right to access a symbol's Quote Overview, Chart, Options Quotes (when available), Barchart Opinion, and Technical Analysis page. Standard Views found throughout the site include:
- Main View: Symbol, Name, Last Price, Change, %Change, High, Low, Volume, and Time of Last Trade.
- Technical View: Symbol, Name, Last Price, Today's Opinion, 14-Day Relative Strength, 20-Day Average Volume, 52-Week High, 52-Week % From High, 52-Week Low, and 52-Week % From Low.
- Performance View: Symbol, Name, Last Price, Weighted Alpha, 5-Day %Change, 1-Month %Change, 3-Month %Change, 52-Week %Change, YTD %Change.
- Moving Averages View: Symbol, Name, Last Price, 20-Day Moving Average, % From 20-Day Moving Average, 50-Day Moving Average, % From 50-Day Moving Average, 100-Day Moving Average, % From 100-Day Moving Average, 200-Day Moving Average, % From 200-Day Moving Average.
- Fundamental View: Available only on equity pages, this view shows Symbol, Name, Market Cap, P/E Ratio (trailing 12 months). Earnings Per Share (trailing 12 months), Net Income (Annual), Beta, Dividend Forward (Annual), Dividend Yield Forward (Annual), and Latest Earnings Date.
Note: For all markets except U.S. equities, fundamental data is not licensed for downloading. Your .csv file will show "N/L" for "not licensed" when downloading from a Canadian, UK, Australian, or European stocks page. - Mini-Chart View: Available for Barchart Plus and Premier Members, this view displays 12 small charts per page for the symbols shown in the data table. You may change the bar type and time frame for the Mini-Charts as you scroll through the page. The default settings for Mini-Charts are found in your Site Preferences, under "Overview Charts".
- Pre-Post Market View: Available for Barchart Plus and Premier Members, this view will show any pre- or post-market price activity for U.S. equities only.
Learn more about Custom Views here.
View Symbol More Data (+)
Unique to Barchart.com, data tables contain an option that allows you to see more data for the symbol without leaving the page. Click the "+" icon in the first column (on the left) to view more data for the selected symbol. Scroll through widgets of the different content available for the symbol. Click on any of the widgets to go to the full page. The "More Data" widgets are also available from the Links column of the right side of the data table.
Flipcharts
Also unique to Barchart, Flipcharts allow you to scroll through all the symbols on the table in a chart view. While viewing Flipcharts, you can apply a custom chart template, further customizing the way you can analyze the symbols.
Flipcharts are a free tool available to Site Members. Learn more about it here.
Download
Download is a free tool available to Site Members. This tool will download a .csv file for the View being displayed. For dynamically-generated tables (such as a Stock or ETF Screener) where you see more than 1000 rows of data, the download will be limited to only the first 5000 records on the table. For other static pages (such as the Russell 3000 Components list) all rows will be downloaded.
Free members are limited to 1 site download per day. Barchart Plus Members have 10 downloads per day, while Barchart Premier Members may download up to 250 .csv files per day.
Note: Due to licensing restrictions, Canadian fundamental data cannot be downloaded from Barchart.com. You will see "N/L" in a downloaded column when this is the case. Fundamental data for US equities is also limited to 15 fields per download request.
Should you require more than 250 downloads per day, you would be best suited with our Barchart for Excel add-in. Free Trial Barchart for Excel