



Download historical Intraday data (when available) back approx. 10 years, down to 1-minute increments. Daily data is available back to 01/01/2000, with Weekly, Monthly, and Quarterly data back to 01/01/1980. A maximum of 20,000 records can be downloaded with any single request. US Equity Options minute data starts March 2023.
Download additional underlying chart data and study values using the Interactive Charts.
Futures data is available by contract, or choose "Nearby" data for continuous data. Contracts will roll based on total volume and open interest. For expired futures contracts, enter the 2-character commodity root (ZC, GC, etc.) followed by the 1-character month code, followed by a 2-digit year. Example: ZCZ05 for Corn December 2005.
Get More Download Flexibility On Historical Data With Barchart for Excel
Barchart for Excel is a powerful tool designed to enrich the data you can find on Barchart.com, but with the added power and flexibility of Microsoft Excel. Blend Barchart data with your own proprietary data, perform calculations, visualize data, and perform sophisticated data analysis directly in Excel. Start your free trial today. Billing begins on the first business day of the next month.
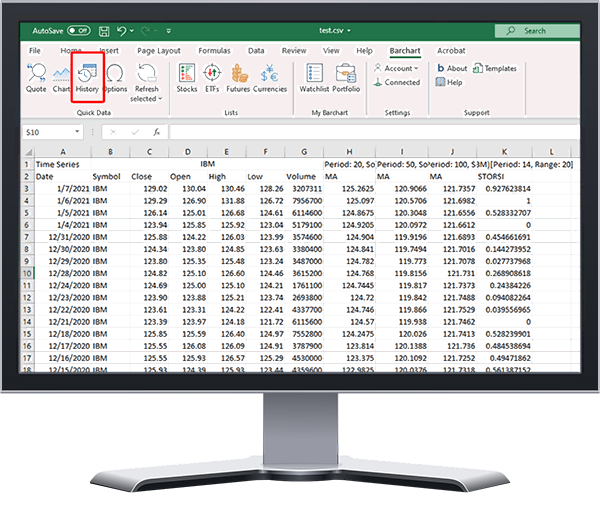
With Barchart for Excel:
- All the Historical Data Download features from Barchart Premier, PLUS ...
- No restrictions on historical start dates, Intraday data back to 01/01/2009 and Daily data back to 01/01/1980.
- Tick data available, along with optional subscription to real-time exchange data.
- Download an unlimited amount of financial data directly into your spreadsheets, up to 100,000 rows of data.
- Easily blend data from Barchart with your own proprietary data or other 3rd party data sources directly in Excel.
- Pull historical data into Excel for deeper analysis with 3rd party tools/languages such as MATLAB, R, Python and others.
- Apply study data from nearly 100 technical indicators directly to Excel.
Start Your Free Trial Today
Billing begins on the first business day of the next month,