
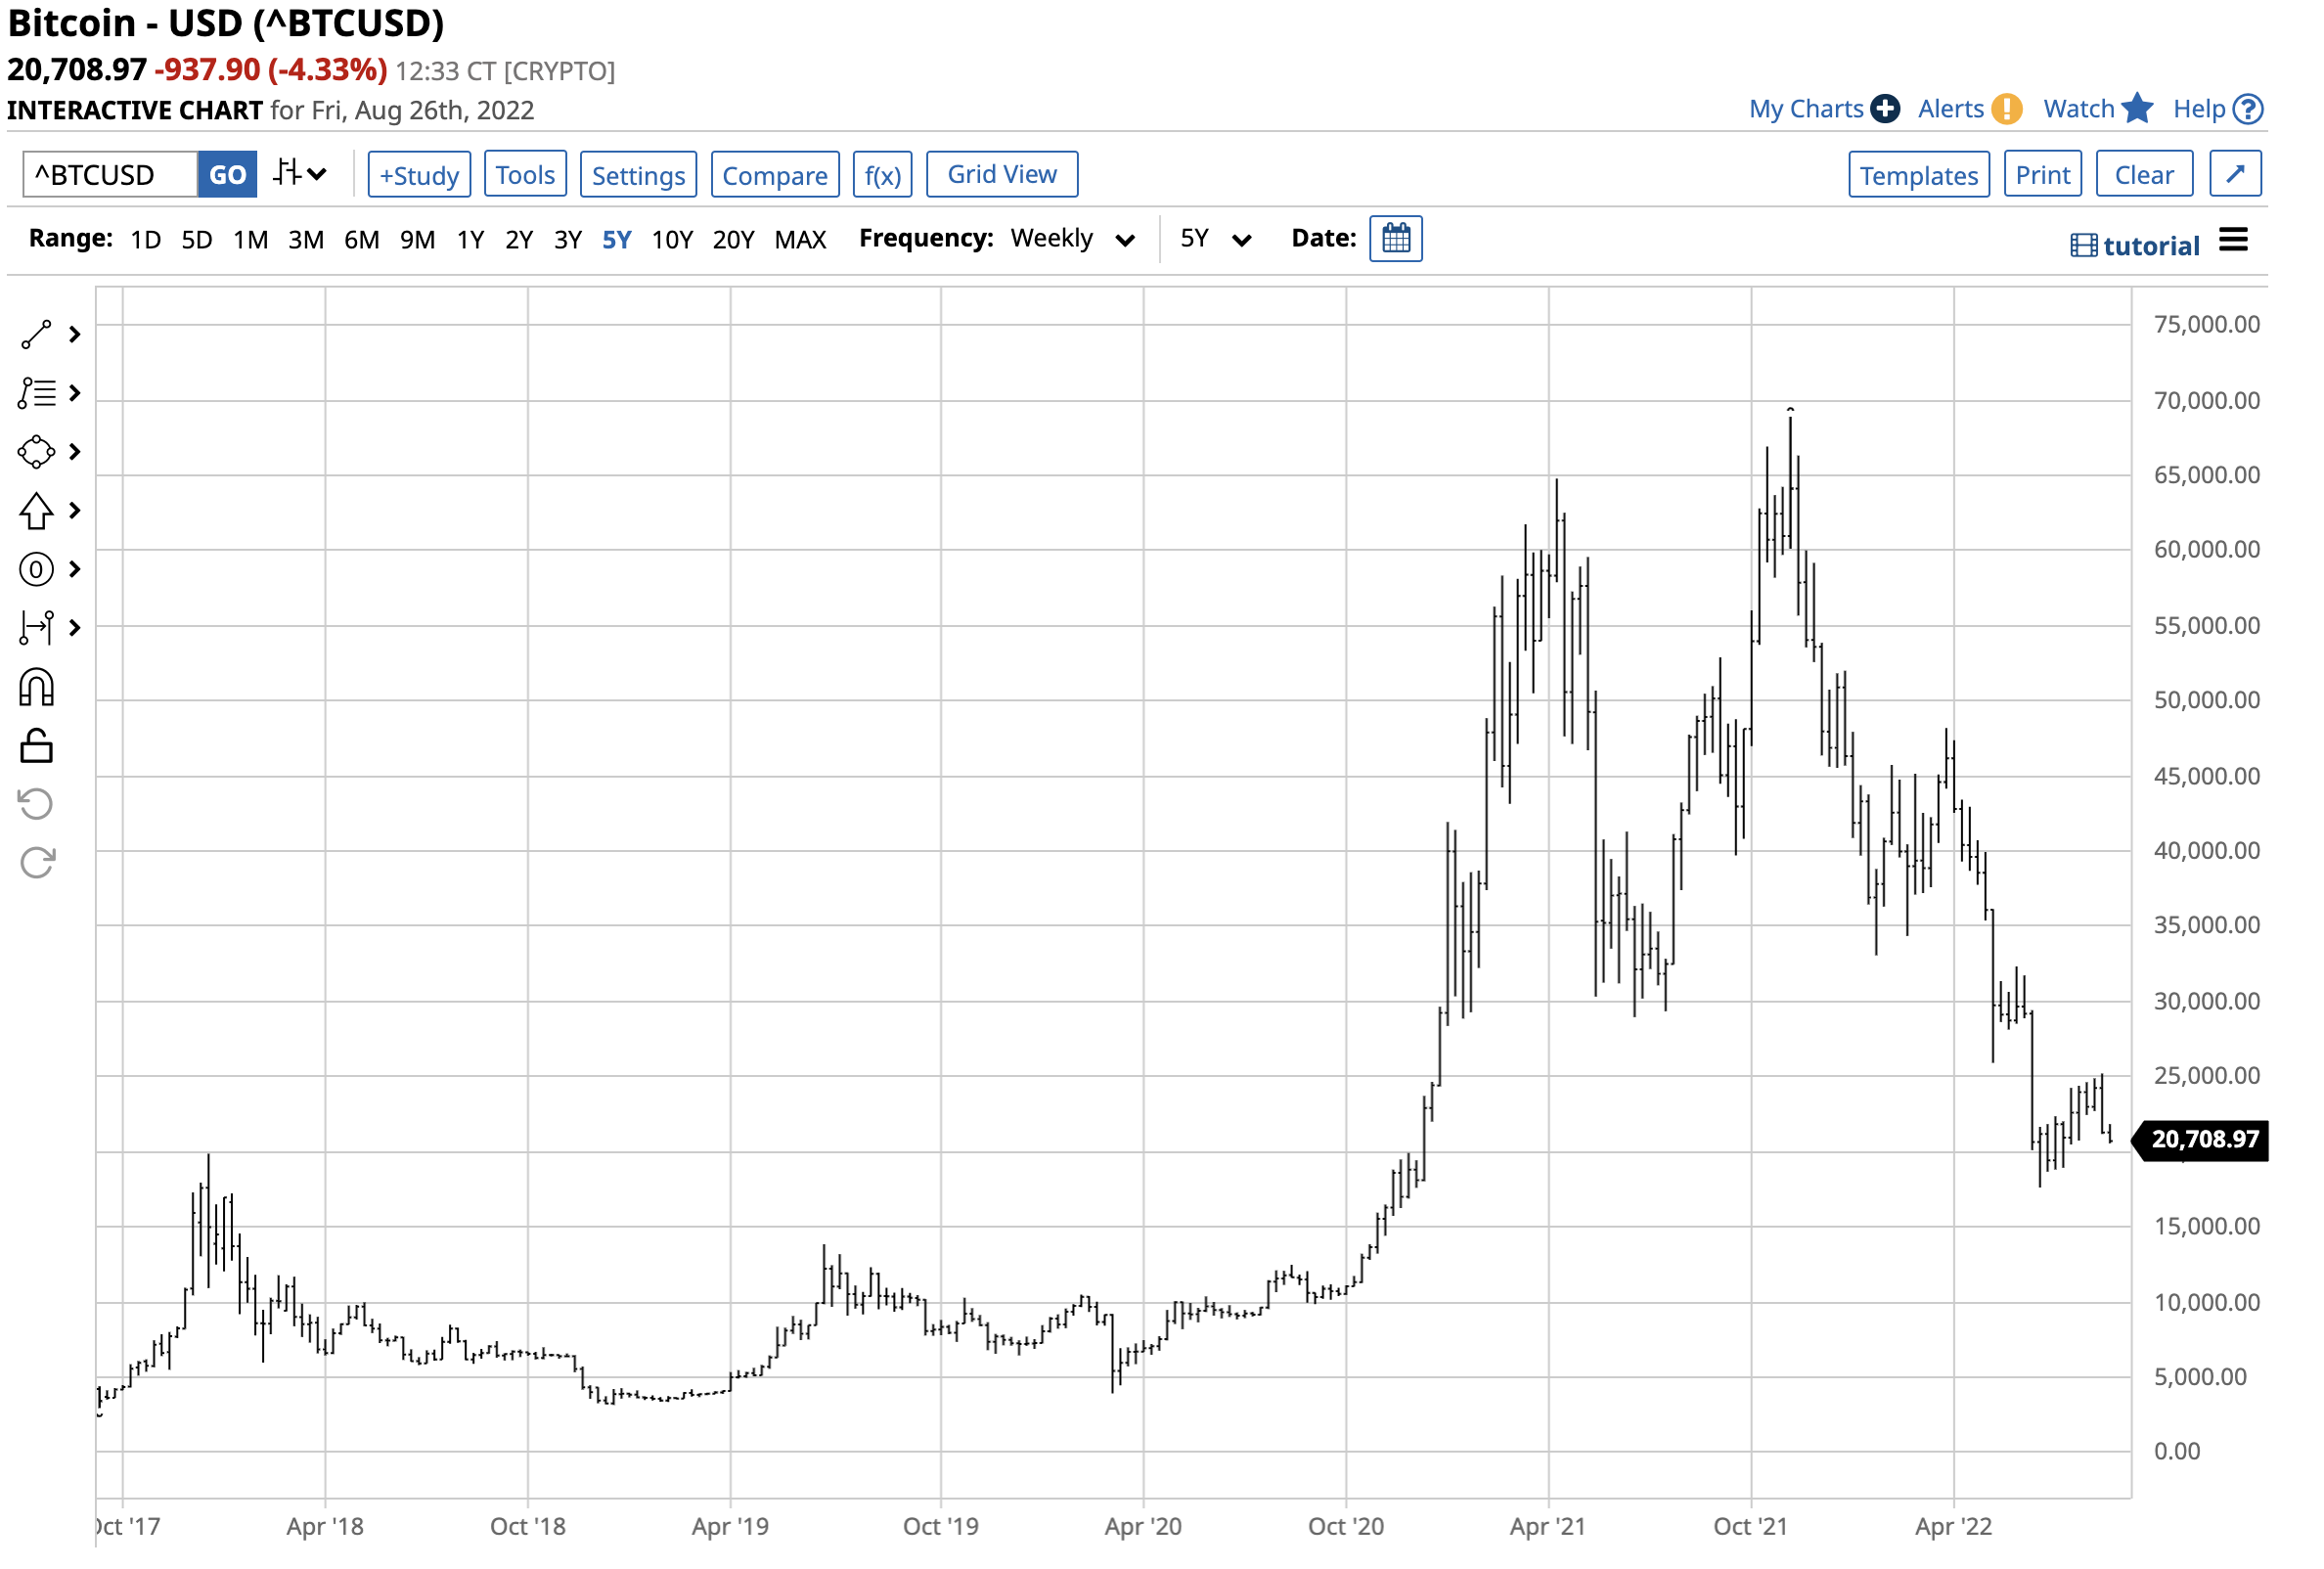
Bitcoin was the first cryptocurrency and remains the leader of the pack. At the $20,700 per token level on August 26, Bitcoin’s market cap was under $397 billion, 39.7% of the total asset class’s market cap of $998.865 billion.
Bitcoin has experienced plenty of explosive and implosive periods since 2010, when the price was as low as five cents per token. In late August 2022, Bitcoin remains at one-third the level at the November 2021 high. However, the short-term price action could be a sign that another boom period could be on the horizon sooner rather than later.
Bitcoin fell from the November 2021 high
Bitcoin experienced a bearish key reversal pattern on November 10, 2021, when the price rose to a new high, reversed, and fell steadily through June 20, 2022.

The chart highlights the pattern of lower highs and lower lows that took the leading cryptocurrency from $68,906.48 on November 10 to $17,614.34 on June 20, a 74.4% decline.
The short-term price action has been more bullish than bearish
Over the past two months, Bitcoin has been digesting the implosive price action, with the price consolidating with an upside bias.
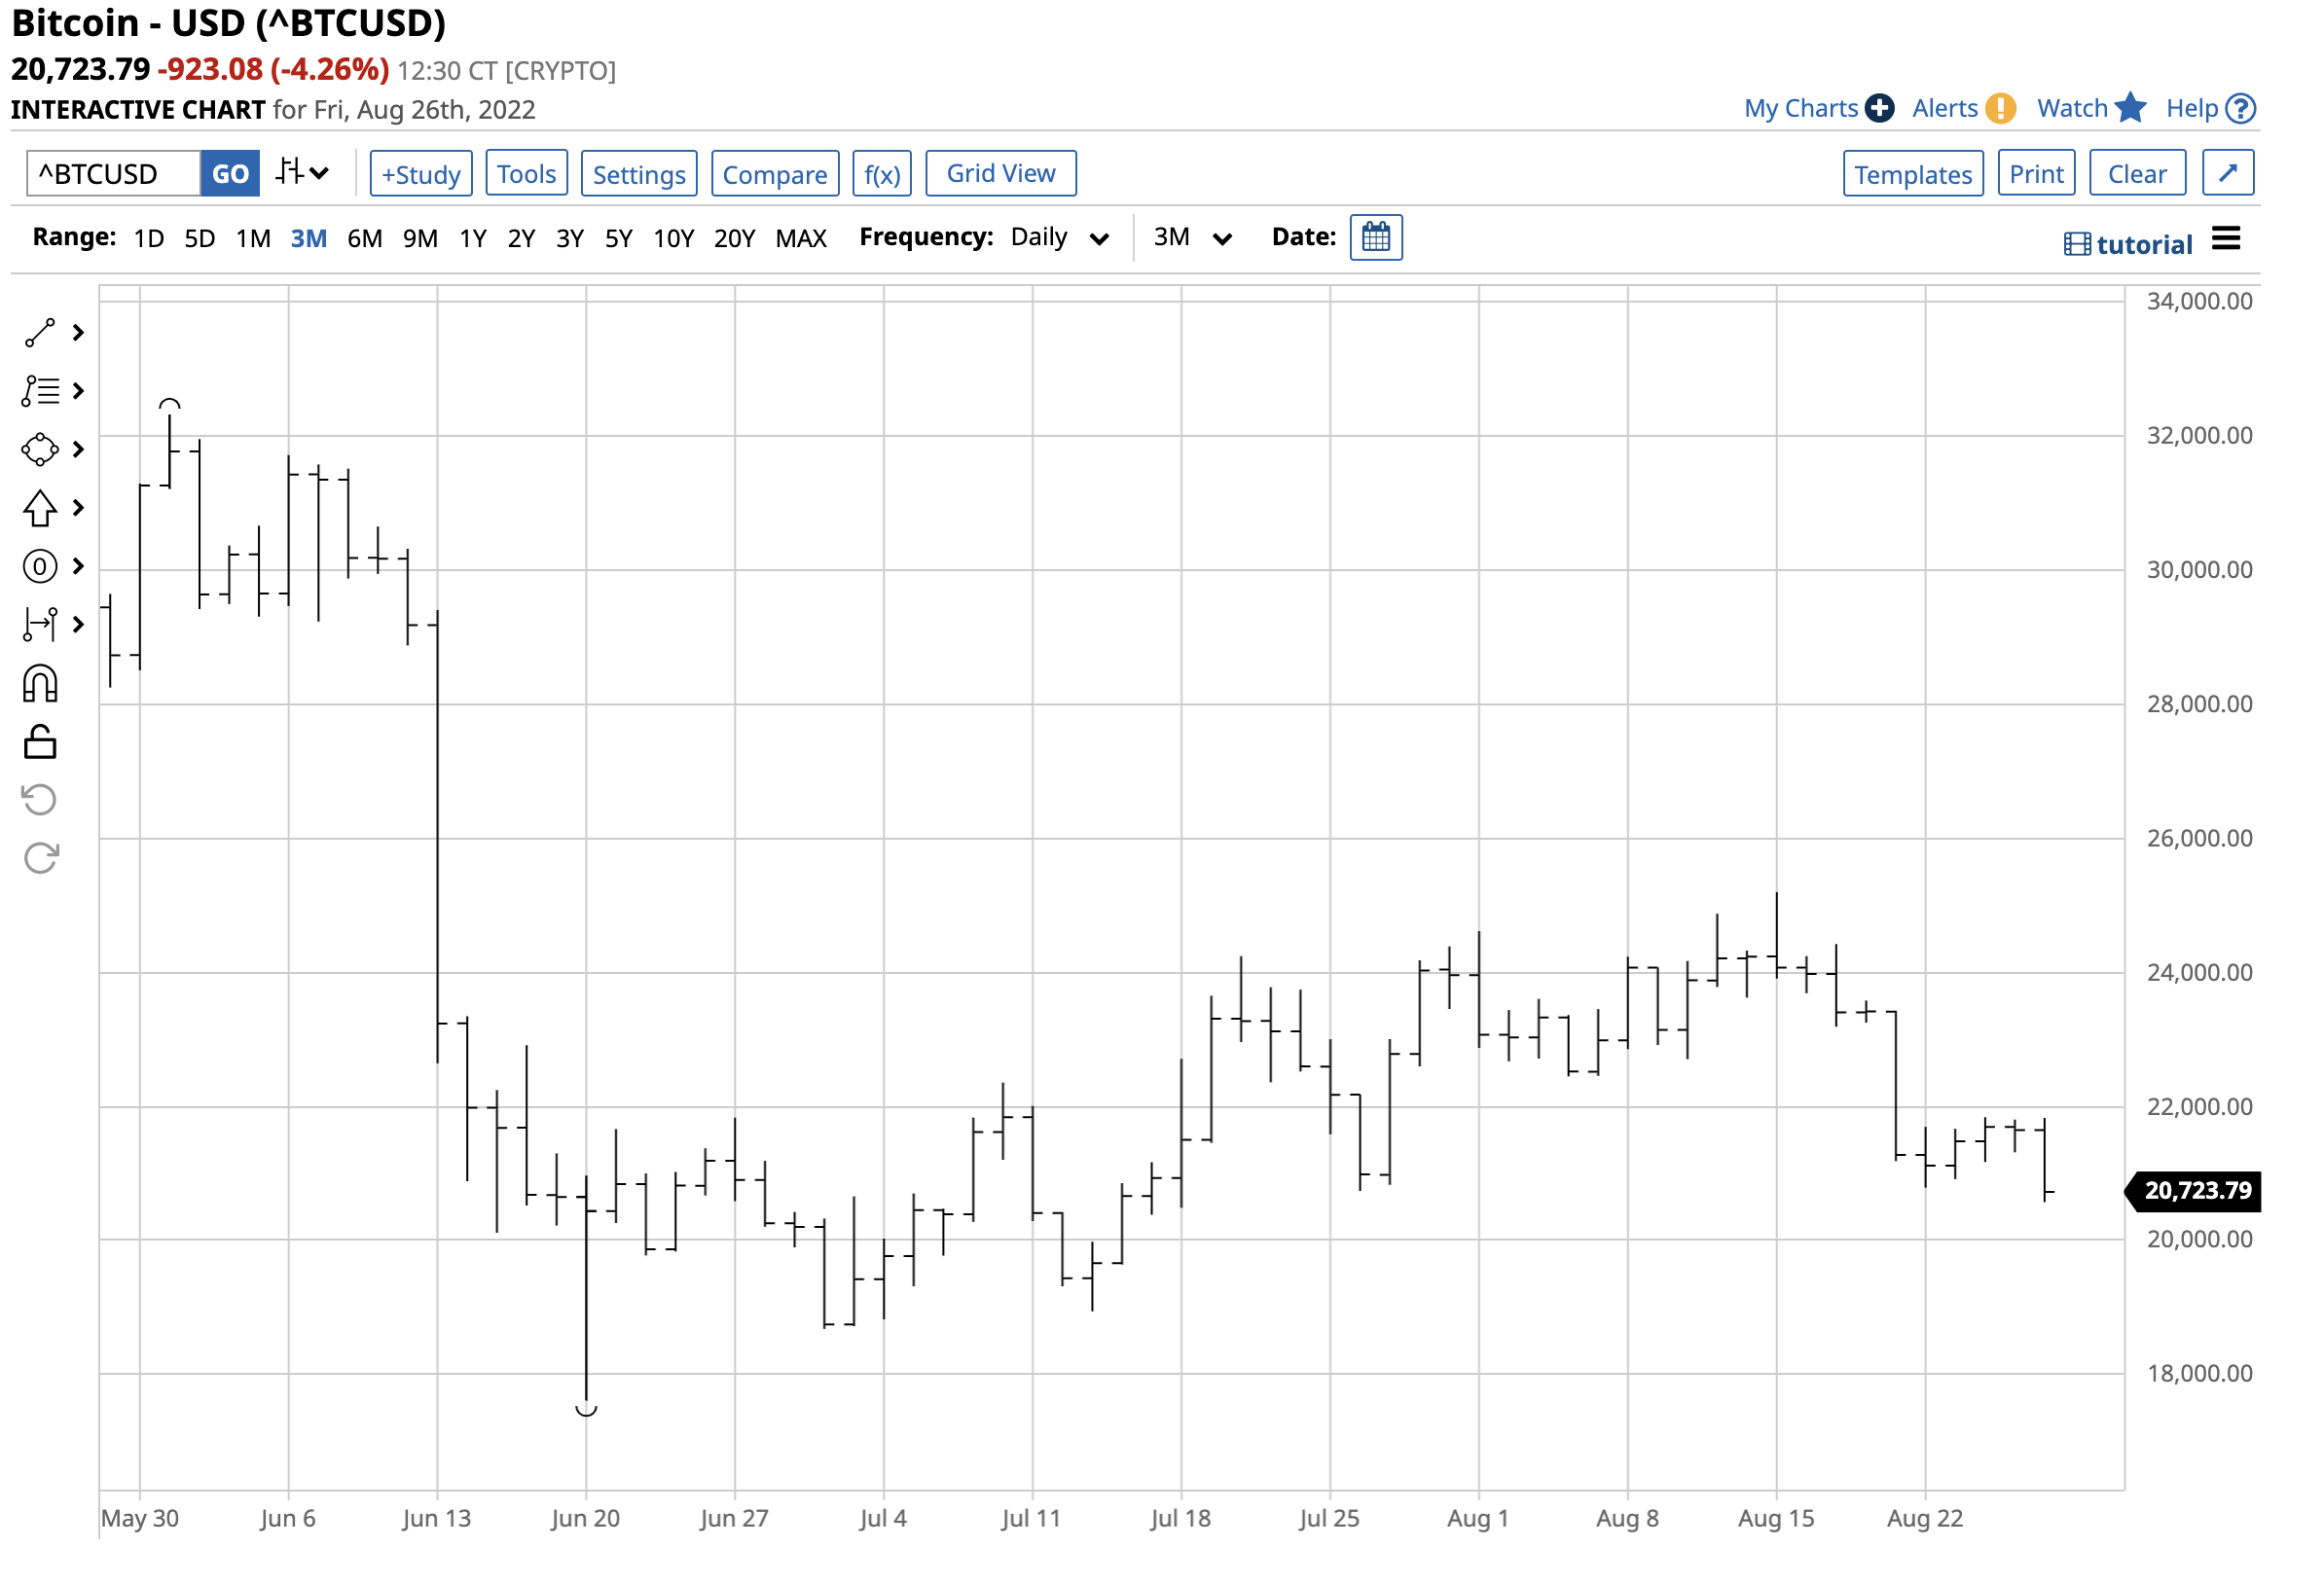
The short-term chart shows that the path of least resistance has been higher, with a pattern of higher lows and higher highs. At the $20,700 level on Friday, August 26, Bitcoin was 17.5% above the June 20 bottom.
Ethereum has led Bitcoin since the recent lows
Ethereum, the second-leading crypto, fell more than Bitcoin from November 10, 2021, through June 20, 2022, posting an 81.8% loss. While Ethereum underperformed Bitcoin during the seven-month correction, it has outperformed the leading crypto since late June.

The short-term chart shows Ethereum at the $1,575 per token level was over 78% above the June 20 $883.159 low on August 26.
Ethereum has outperformed Bitcoin as Ethereum 2.0 rolled out. The proof-of-stake versus the old proof-of-work protocol that Ethereum 1.0 and Bitcoin operate under likely caused the outperformance since the June 20 low.
Price levels to watch over the coming days and weeks
Market participants could be waiting for Bitcoin and Ethereum to eclipse critical technical resistance levels before piling back into the cryptocurrencies.
The chart shows that Bitcoin’s resistance levels stand at the May 30 $32,329.54 high and the March 28 $48,187.21 peak.
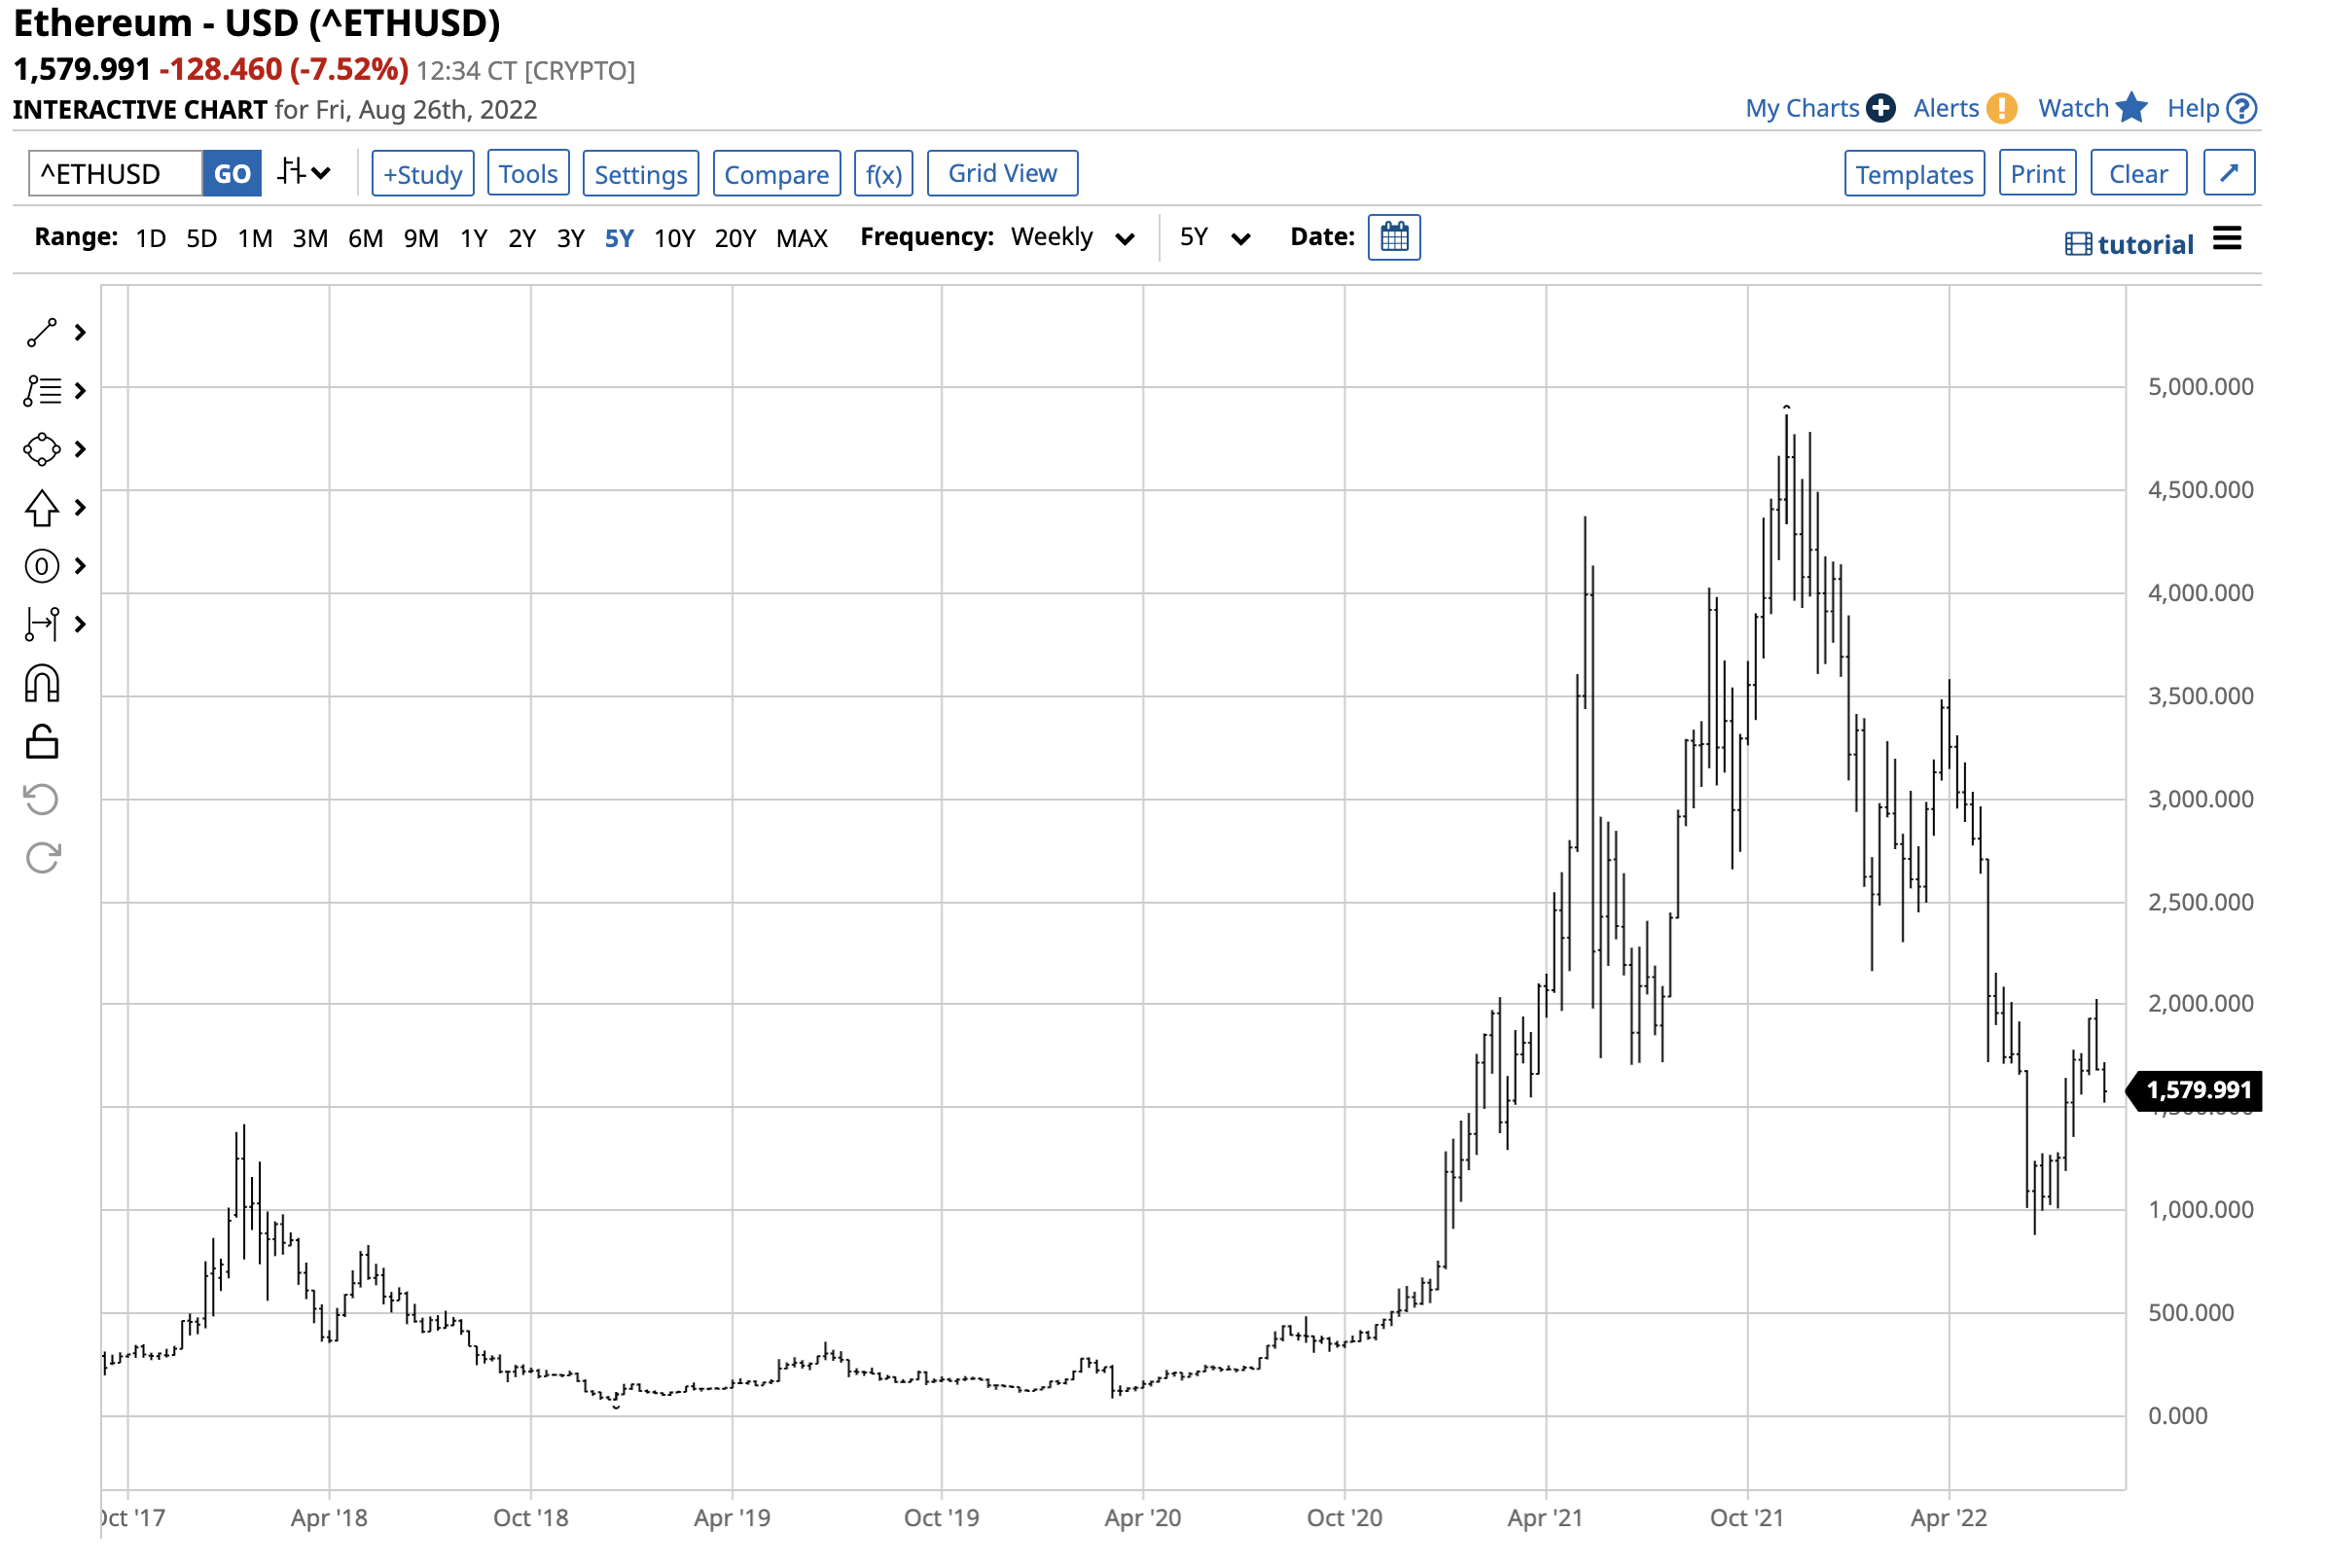
Ethereum’s critical resistance levels are at the recent August 15 $2,028.65 high and the April 4 $3,579.866 peak. A move above those levels could trigger a flurry of technical buying, pushing the leading cryptos and the over 20,750 others towards challenges of the November 2021 highs.
Technical and fundamental events trigger the boom-and-bust price action
Bitcoin and Ethereum have experienced boom-and-bust price action over the past years. While Bitcoin plunged 74.4% and Ethereum’s value evaporated by over 90% from late last year through June 20, 2022, the declines were not the worst for the cryptos. After reaching a high in late 2017, Bitcoin posted an over 84% drop, and Ethereum fell by more than 94% over the period.
The cryptos have rallied when events that expand the addressable market foster buying. In late 2017, futures contracts on Bitcoin spurred furious buying. More recently, acceptance by companies for payments and high-profile buyers like Elon Musk and Jack Dorsey caused market participants to follow, pushing prices to higher highs.
Bitcoin and Ethereum are waiting for the next event to push them over the edge, take out critical technical resistance levels, and cause rallies that challenge the November 10 highs. The asset class’s wild volatility is a reason to be cautious and only invest capital you are willing to lose. The potential for outsized rewards always comes with oversized risks. If history is a guide, the odds favor another boom period after the recent busts.
More Crypto News from Barchart


/Alphabet%20(Google)%20Image%20by%20Markus%20Mainka%20via%20Shutterstock.jpg)