- I use Barchart’s Trend Seeker® system and moving averages to time “Buy the Dip” entries for the Vanguard Total Stock Market ETF (VTI) and any other security.
- For short-term trades, I combine the Daily Trend Seeker with the 50-day moving average and 50-day Turtle Channel to smooth price noise and confirm “buy” signals.
- In my long-term portfolio, I rely on the Weekly Trend Seeker and 50-week moving average, entering when both align for a “buy” signal after a dip.
- To manage risk, I always set a stop loss immediately after entry, tailored to my personal loss tolerance.
In today’s Chart of the Day you’ll get not one, but two charts. I hope these two charts will give you some rational guidance on how to “Buy the Dip.”
I don’t care which financial channels and programs you listen to, but all those “experts” are telling you to “buy the dip.” But no one is telling you how.
The main problem with buying the dip is determining when to buy the dip. Buy in too soon and you have grabbed the falling knife. You are now in a position that is losing you money every day.
Buy in at the wrong time and you might get whipsawed back and forth and be tempted to buy in and out and back in and out and lose money on every trade.
A problem you usually face is that the market does not go down and then back up in a straight and predictable line. It goes up and down in seemingly random patterns that are too hard to predict.
I have 2 main portfolios: 1) a short-term trading portfolio and a long-term investing portfolio and my entry and exit points are computed differently.
Barchart has some tools you must learn to use: Chart Templates and the Trend Seeker.
The Trend Seeker® is a computerized trend analysis system, developed by Barchart.com. The system uses a combination of wave theory, market momentum, and volatility in an attempt to find a general trend for a specific market. Trend Seeker® attempts to cut losers early and let winners run.
A graphical interpretation of Trend Seeker® can be viewed using Interactive Charts.
- When there is a single dot above the price, this is a resistance point and represents a bearish trend.
- When there is a single dot below the price, this is a support point and represents a bullish trend.
- When there are 2 dots, one above and one below the price, this represents a neutral or hold trend (these are the entry prices to make a new buy or sell trade).
- When a trend EXITS either a bullish or bearish trend, the trend is forced as a neutral trend for at least one day.
For my short-term trading portfolio I use a Daily Trend Seeker and for my long-term investing portfolio I use a Weekly Trend Seeker.
Let me demonstrate using chart of the Vanguard Total Stock Market ETF (VTI).
My first chart uses:
- Price
- Daily Trend Seeker
- 50-Day Moving Average
- 50-Day Turtle Channel
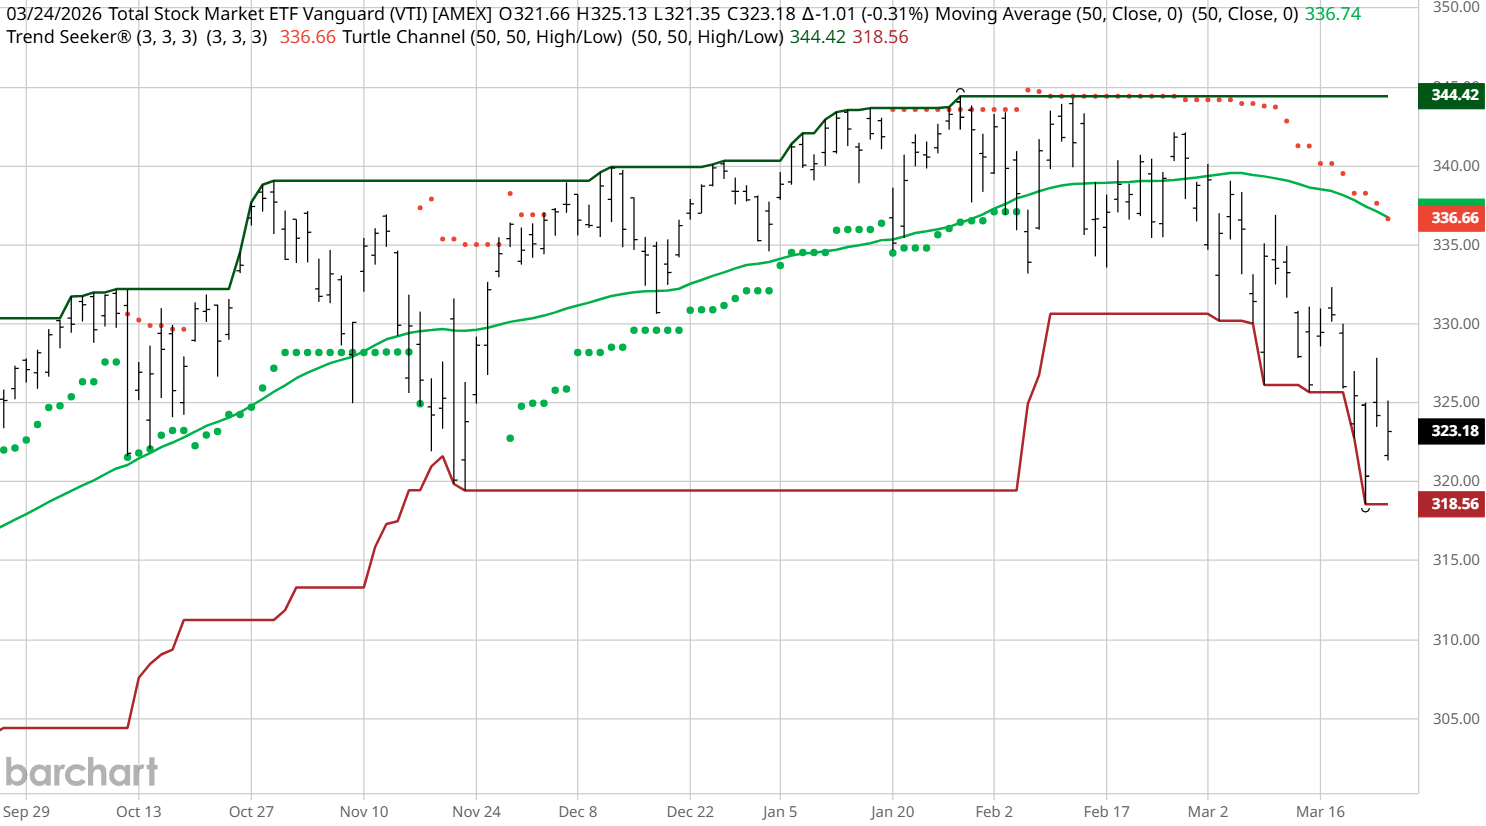
You can see how I have smoothed out the daily random price movements and can buy back in when the price crosses the 50-Day Moving Average and the Trend Seeker signals a confirming “Buy.”
My long-term investing portfolio uses a similar chart but instead uses:
- Price
- Weekly Trend Seeker
- 50-Week Moving Average
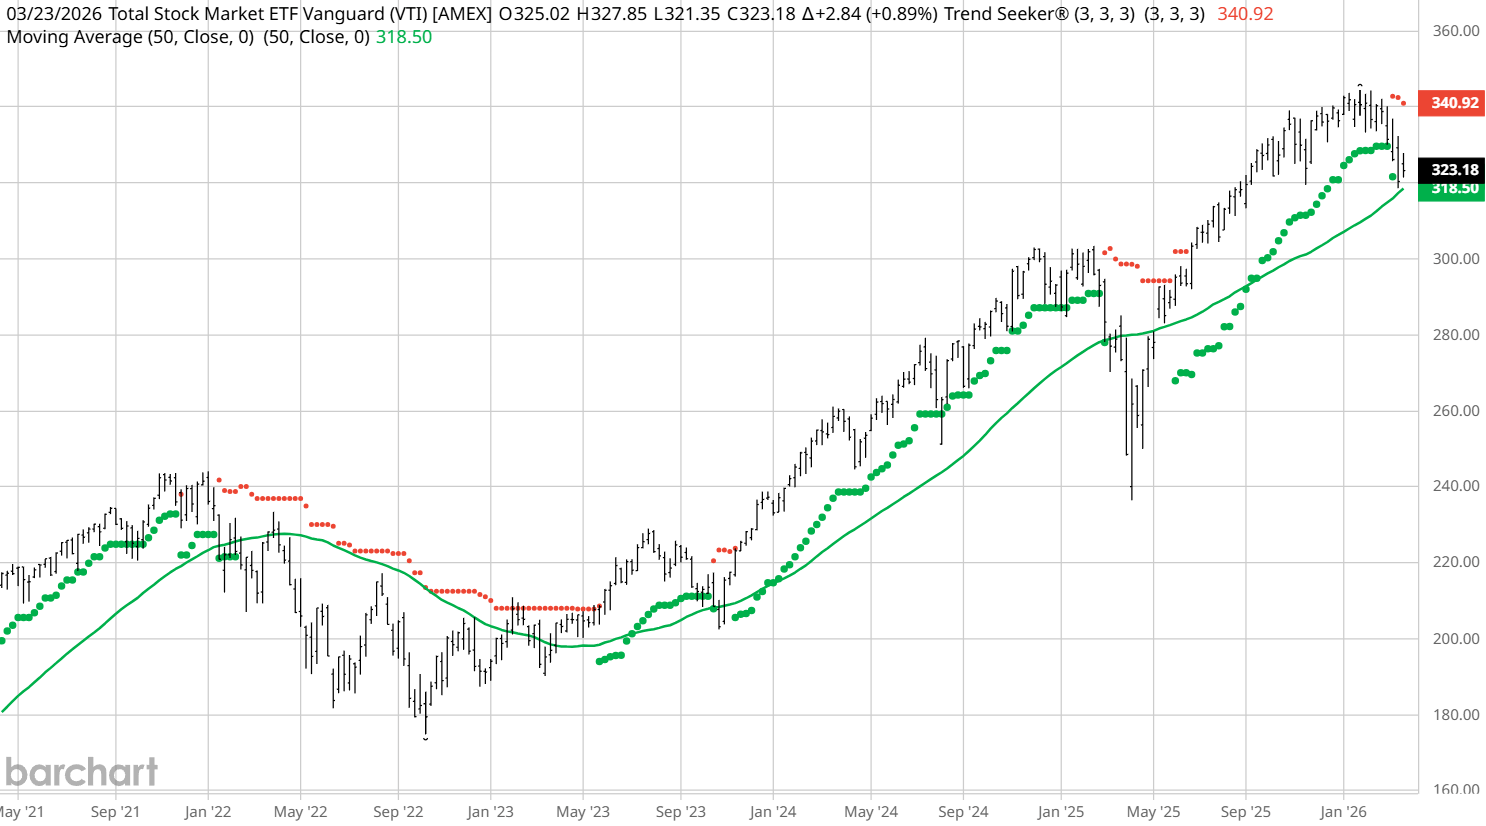
Instead of covering a 6-month period like my Daily Chart, the long-term Weekly Chart still gives me information I can use to buy into the long-term dips. Again, I buy back in when the Price crosses the 50-Week Moving Average and I have a confirming Weekly Trend Seeker Buy signal.
No system is 100% foolproof, but this method can help you avoid grabbing a falling knife and getting whipsawed and churning into losses.
Lastly, as soon as your buy clears, IMMEDIATELY place your stop loss in at your personal investment tolerance for loss in case you are wrong.
Additional disclosure: The Barchart Chart of the Day highlights stocks that are experiencing exceptional current price appreciation. They are not intended to be buy recommendations as these stocks are extremely volatile and speculative. Should you decide to add one of these stocks to your investment portfolio it is highly suggested you follow a predetermined diversification and moving stop loss discipline that is consistent with your personal investment risk tolerance.
On the date of publication, Jim Van Meerten did not have (either directly or indirectly) positions in any of the securities mentioned in this article. All information and data in this article is solely for informational purposes. For more information please view the Barchart Disclosure Policy here.
/CPU%20Chip.jpg)
/Intel%20Corp_%20Santa%20Clara%20campus-by%20jejim%20via%20Shutterstock.jpg)
/Microsoft%20Corporation%20logo%20on%20sign-by%20Jean-Luc%20Ichard%20via%20iStock.jpg)

/A%20Palantir%20office%20building%20in%20Tokyo_%20Image%20by%20Hiroshi-Mori-Stock%20via%20Shutterstock_.jpg)