
The USD/CAD pair is currently facing a fundamental tug-of-war as the first quarter of 2026 comes to a close. While geopolitical tensions and a "risk-off" sentiment provide a catalyst for a higher USD, surging oil prices driven by the U.S.-Israel-Iran war are acting as a significant tailwind for the Canadian Dollar (CAD), keeping the pair in a volatile, range-bound state.
Fundamental Catalysts for USD/CAD Price Movement
- Geopolitical Safe-Haven Demand: Escalating military strikes between the U.S., Israel, and Iran have driven investors toward the U.S. Dollar as a safe-haven asset, creating upward pressure on the USD/CAD pair.
- Monetary Policy Divergence: On March 18, 2026, the Bank of Canada (BoC) held its policy rate steady at 2.25%, signaling it would "look through" immediate oil-related inflation due to economic slack.
- Technical Resistance: Analysts note strong resistance for USD/CAD above the 1.3700 level, with a fundamental "fair value" estimate closer to the mid-1.34s, suggesting the pair may be currently overvalued.
Macro Events Driving the Canadian Dollar (CAD) Higher
The Canadian dollar is primarily supported by its status as a major energy exporter during this period of global supply disruption.
- Surging Oil Prices: Crude oil has jumped significantly amid the conflict, with WTI hitting a high of $120/bbl during the initial price surge. Higher prices improve Canada's terms of trade and increase demand for CAD.
- Supply Chain Shocks: Disruptions in the Strait of Hormuz have halted nearly 20 million barrels per day of oil and product exports, forcing global markets to rely more heavily on non-Middle Eastern producers, such as Canada.
- Narrow Yield Spreads: Despite the BoC holding rates, the gap between Canadian and U.S. yields remains underpinning the CAD.
Impact of the U.S.-Israel-Iran War
The war is the dominant driver of current market volatility, affecting the CAD through two conflicting channels:
- Positive (Commodity Channel): The war has caused a massive "cost-push" inflation shock, with oil prices rising as high as 59% since hostilities began on February 28, 2026. This acts as a buffer for the CAD, allowing it to outperform other major currencies, such as the Japanese Yen.
- Negative (Risk Sentiment): The threat of a wider regional war and the potential for stagflation create a "risk-off" environment, which typically favors the USD over cyclical currencies like the CAD.
Difference Between Spot and Futures Prices
The primary difference between Canadian dollar (CAD) spot prices and futures contracts is the timing of the transaction and delivery. Spot prices represent the “on the spot” market rate for immediate exchange, while futures contracts are standardized agreements to trade at a set price on a specific future date.
Core Distinction
- Pricing Direction: Canadian dollar spot markets are typically quoted as USD/CAD (how many CAD for 1 USD), whereas CAD futures are quoted as CAD/USD (the value of 1 CAD in USD).
Technical Picture
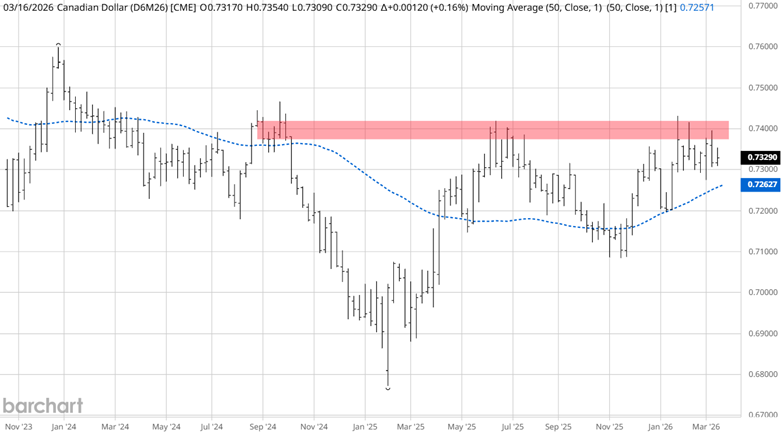
Source: Barchart
The weekly chart of nearby Canadian dollar futures shows overhead resistance challenging prices at the current level. While the weekly trend is supported by an upsloping 50-week simple moving average (SMA), multiple retests of the SMA support higher prices. Additionally, the higher-highs-and-higher-lows price structure is another technical tool for defining an uptrend.
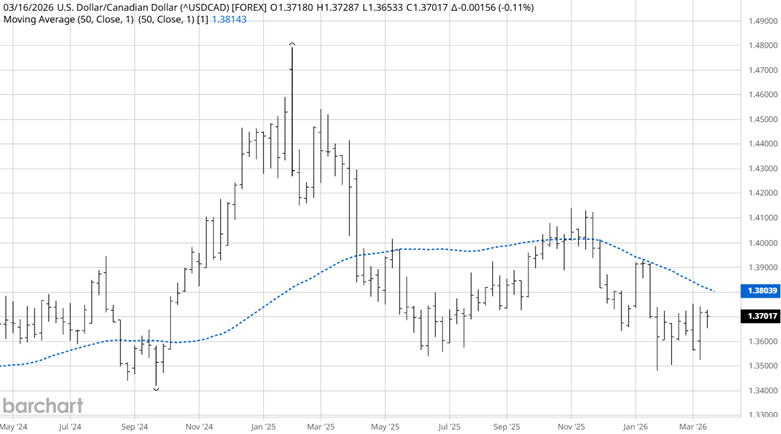
Source: Barchart
The weekly chart of nearby Canadian dollar spot prices shows an inversion between the futures and spot markets.
Seasonal Pattern
Moore Research Center, Inc. (MRCI) 15-year research finds that historically, Canadian dollar futures contracts reach their seasonal high in August. And they reach their seasonal low during the last week of the first quarter, in the latter portion of March and the early days of April.
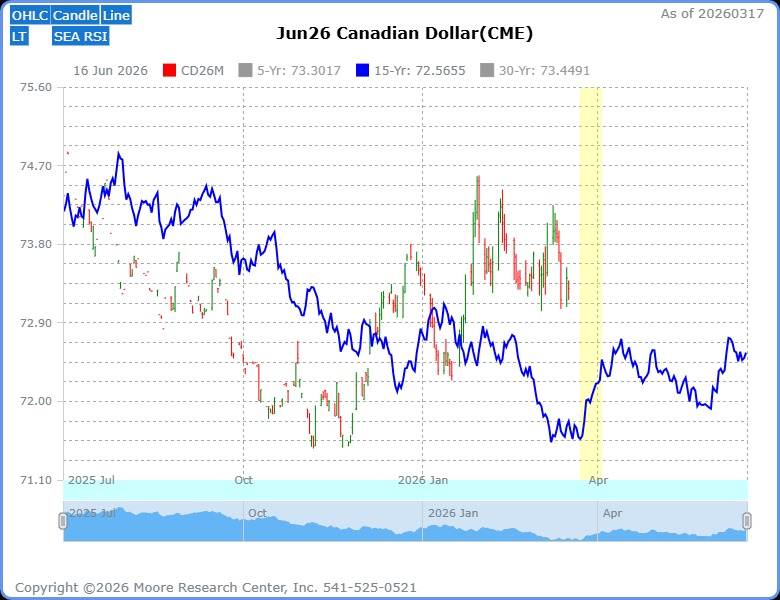
Source: MRCI
For traders looking for a short-duration trade, 12 calendar days, MRCI has identified a seasonal buy pattern (yellow box) in the Canadian dollar June futures contract (in the spot market, this would be a seasonal sell period).
By analyzing the past 15 years of trading, MRCI has found that the June Canadian dollar futures contract has closed higher on approximately April 03 than on March 23 in 14 of the past 15 years, a 97% occurrence. During the hypothetical testing, they found the average net profit per trade to be $767.33 per standard-size future contract.
As a crucial reminder, while seasonal patterns can provide valuable insights, they should not be the basis for trading decisions. Traders must consider various technical and fundamental indicators, risk management strategies, and market conditions to make informed, balanced trading decisions.
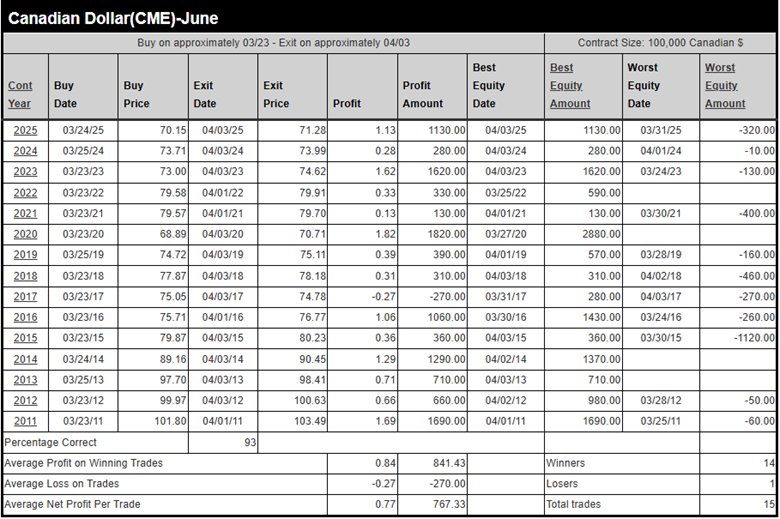
Source: MRCI
During this 12-day optimal window, there were 4 years with no daily closing drawdown.
Assets to Trade the Canadian Dollar
Traders can trade the standard-size futures contract (D6) and the micro-futures (WK) to participate in this opportunity. There are also options available to trade on the (D6) contract. Spot market traders can trade the USD^CAD.
In Closing…
As this quarter wraps up, the USD/CAD story ultimately comes down to weighing two powerful and opposing forces: safe-haven demand pushing the U.S. dollar higher versus surging oil prices strengthening the Canadian dollar. With crude's sharp rally—driven by supply disruptions and geopolitical conflict—continuing to improve Canada's trade outlook and support CAD, traders should be cautious about chasing USD strength, especially with technical resistance near 1.3700 and fair-value estimates closer to the mid-1.34s, suggesting potential overvaluation. At the same time, the broader risk-off environment and uncertainty tied to the ongoing conflict can't be ignored, as it still favors the USD in periods of market stress. Add in the seasonal tendency for CAD to bottom in late March and strengthen into early April. The case becomes clearer: rather than taking a one-sided view, disciplined traders should focus on timing, respect key technical levels, and balance macro drivers and seasonal patterns to make rational, well-informed decisions in what remains a highly volatile, headline-driven market.
On the date of publication, Don Dawson did not have (either directly or indirectly) positions in any of the securities mentioned in this article. All information and data in this article is solely for informational purposes. For more information please view the Barchart Disclosure Policy here.
/Micron%20Technology%20Inc_%20logo%20on%20building-by%20vzphotos%20vis%20iStock.jpg)


/Semiconductor%20chip%20by%20Mykola%20Pokhodzhay%20via%20iStock.jpg)
/Lululemon%20Athletica%20inc_%20storefront%20by-%20Robert%20Way%20via%20iStock.jpg)