- Thursday will see the release of the third first look at new-crop gain and oilseed supply and demand guesses by USDA, and the industry in general is beside itself with anticipation.
- The reality is, though, basis and futures spreads show us real fundamentals every hour of every trading day. All we have to do is understand the key reads of basis and futures spreads.
- In the case of corn, both old-crop and new-crop, everything we need to know can be seen in the Barchart National Corn Basis index and the futures market's inverted forward curve.
Well, we’ve reached the day of the May round of USDA supply and demand reports, a much-ballyhooed day when the majority of the industry (namely ag media and USDA regurgitators) get their knickers in a twist over the third first look at imaginary new-crop supply and demand numbers. “The third first look?”, you ask? Yes. We’ve seen these numbers and guesses before in USDA’s February Ag Outlook Forum (trend line yield) and the always entertaining (rather than informative) end of March Prospective (as in expected, or maybe) Plantings report. And that’s just on the production side. The day’s real fun is in watching those who follow such things react to made-up demand numbers for next year. After 30-plus years of watching this hilarity, Thursday should be just another day.
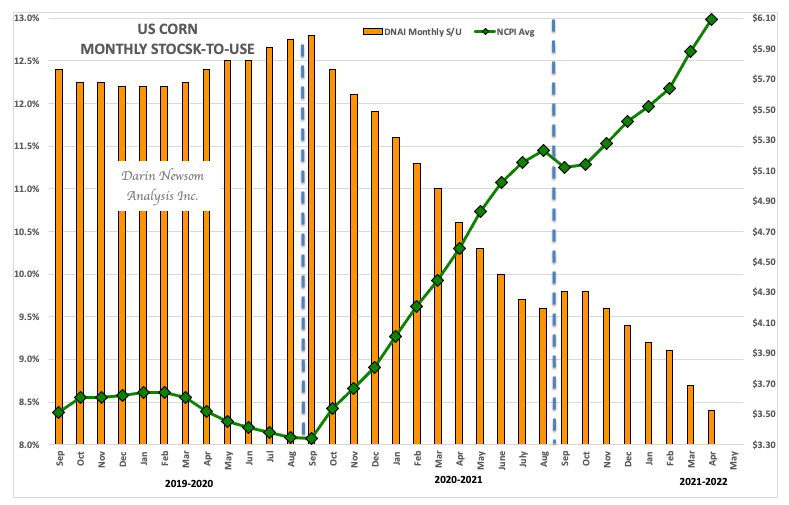
Fundamentally, what will we know about old-crop corn at the end of today that we don’t know this morning? Nothing. My end of April US available stocks-to-use calculation, based on the marketing year daily average price of the Barchart National Corn Price Index (ZCPAUS.CM), came in at 8.4% as compared to the previous month’s 8.7% and previous April’s 10.6%.

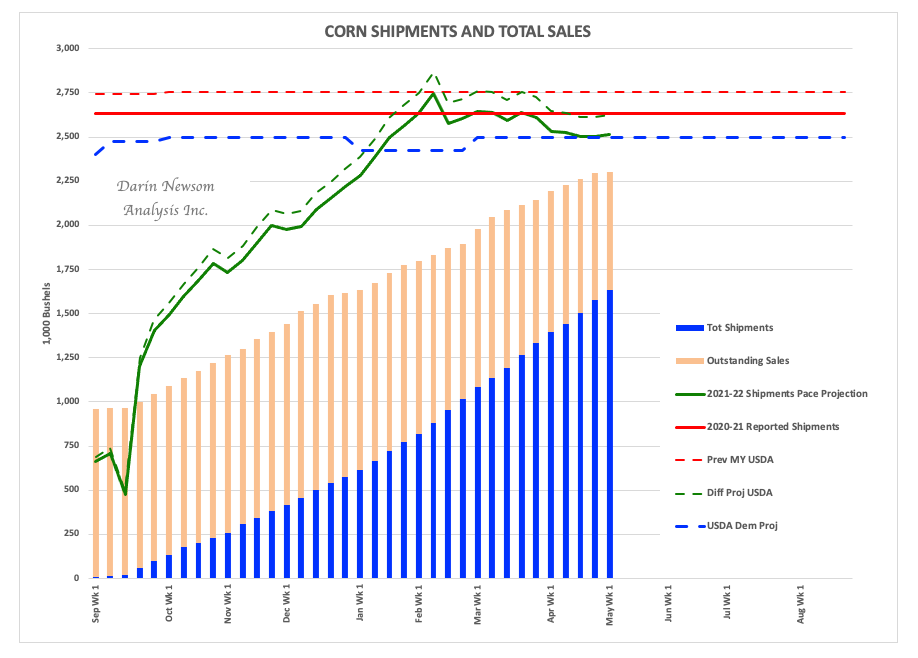
Additionally, the Barchart National Corn Basis Index (ZCBAUS.CM) continues to strengthen indicating demand remains solid. Where’s the demand coming from? Bearish live cattle spreads tell us there are a lot of cattle on feed that need to , RBOB gasoline’s forward curve remains inverted telling us there is a lot of demand for gasoline and ethanol, and the latest update of export sales and shipments showed export demand remains strong. My calculated pace projection was 2.515 bb (solid green line), and with total sales at 2.3 bb (combination blue/orange columns) the implication is exporters still have at least 2.0 bb to find in this tight available stocks environment.
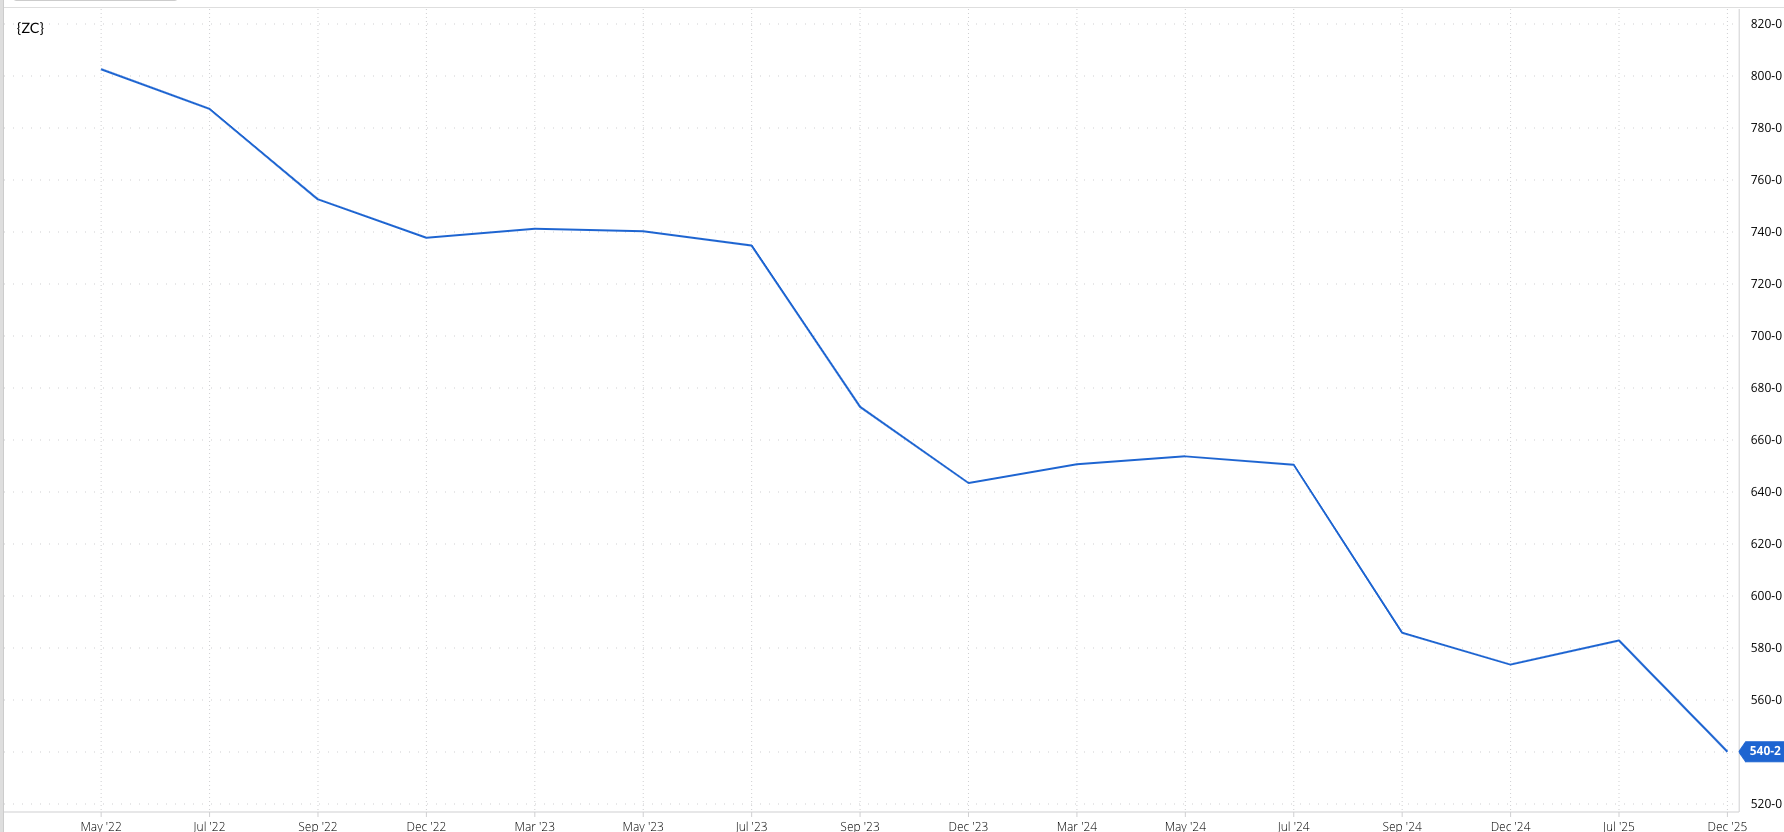
As for new-crop, all we need to know can be seen in the inverted Dec22-to-July23 forward curve. This tells us the commercial side believes, at least for now, 2022 production (acres, yield, etc.) will not be enough to loosen the tight supply and demand situation.

/AI%20(artificial%20intelligence)/Businessman%20touching%20the%20brain%20working%20of%20Artificial%20Intelligence%20(AI)%20Automation%20by%20Suttiphong%20Chandaeng%20via%20Shutterstock.jpg)
/Intel%20Corp_%20Santa%20Clara%20campus-by%20jejim%20via%20Shutterstock.jpg)
/EV%20in%20showroom%20by%20Robert%20Way%20via%20Shutterstock.jpg)