Chart of the Day
The information and opinions expressed below are based on my analysis of price behavior and chart activity
Sign Up to receive Walsh Trading’s 1st Half of 2026 Market Outlook First Half of 2026 Outlook for the Livestock and Grain markets.
Thursday, February 5, 2026
If you like this article and would like to receive more information on the commodity markets from Walsh Trading, please use the link to join our daily email list -Click here
March Silver (Daily)
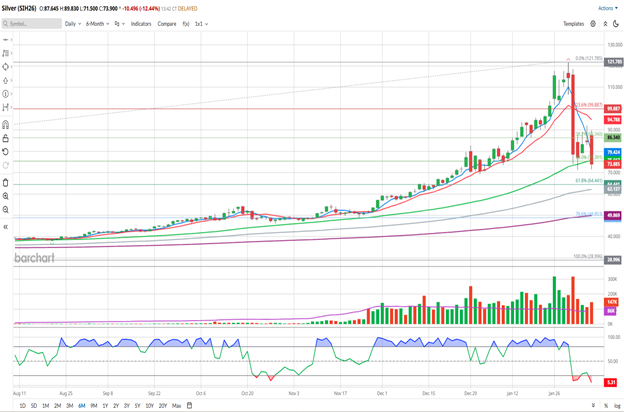
(As of this writing, the market is not closed. Charts may look different after the market stops trading at 4 PM CT and the 12:30 PM CT “Settlement” is applied)
Today, March Silver is trading near the 74.000 mark, down about $10.40 cents on the day. If it were to settle here, this would post the lowest close since January 5th. Since reaching a peak of 121.785 on January, Silver prices have dropped by about $48.000 over the span of 6 trading days. This setback in prices is due, in part, to several factors, in my opinion.
First off, the market may have run too far and too fast. The COMEX exchange has raised margins or performance bonds dramatically, most recently on February 2nd, to the current level of 16.5% of the contract value. I think they do that in an effort to curb “irrational exuberance”, to try to maintain an orderly market and to ensure that all parties can meet their financial obligations. One consequence of a margin change like that is that the weaker hands, so to speak, get forced out of the markets. And that’s a big part of the recent price weakness, I think. That alone should not force a bearish market condition, as prices typically settle back a bit before resuming their previous trend. However, markets don’t typically drop by 50%, as a result. And I can’t recall a day like last Friday, where a metal market has dropped 31% in a day. (during Covid, Crude Oil prices did drop more than that) So this may be a bit different. Second, I’m also reading reports that someone in China has initiated a massive short position in Shanghai Silver futures, potentially greater than the reserves that the exchange maintains. That could be a very bearish problem for this market. Or it could be a very bullish situation, if those short positions are forced to liquidate. It’s China, so news is not always forthcoming and we’ll have to wait and see how/if that works out. At the moment, I’m leaning more toward the bearish side of the market.
Looking at the chart above, you may notice a few things. The 5- and 10-day moving average (Blue/Red) made a bearish crossover on Monday of this week. Prices did rally on Wednesday to test the 5-day average, but failed to close back above it. Today’s trade also failed to hold that as support. Currently the 5-day is near 79.315 and the 10-day is near 94.725, and I would see both of those levels as resistance right now. Today’s trade has also pushed the market below the 50-day moving average (green, 75.656) That moving average can be viewed as a medium-term trend measure and it’s an average where I would expect to see “commodity fund” trade activity. Closing below that average is not usually a bullish signal. You may notice that prices haven’t really interacted with that average since last August and we’ve hit it twice in the past 4 trading sessions. The 50-day is still inclined higher. As are the 100- and 200-day averages (grey/purple) which are offering potential support levels near 62.130 and 49.866, respectively. Yesterday’s trade left a spike high at 92.015, but settled very near where it opened, which indicates to me a lack of buying interest to my eye. Stochastics (bottom sub-graph) have dipped into an oversold condition. That’s a pretty dramatic reversal over the past 5 days!
I’ve also drawn a Fibonacci retracement on this chart. It may be tough to discern on the daily chart above, but the weekly chart may offer a better view of it for you. More on that below….
March Silver (Weekly)
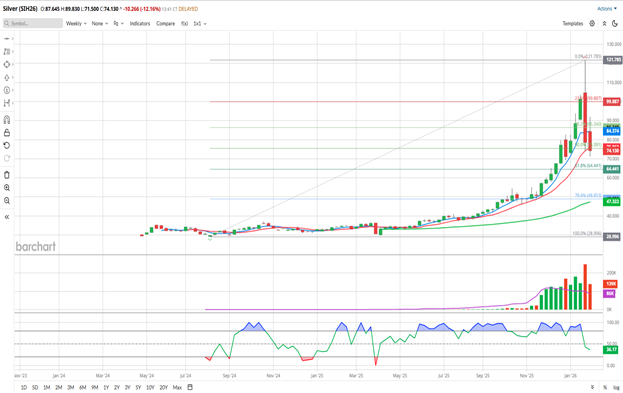
So far this week, or at least as of this writing (72.550 last trade on my screen) is down about $6.00 or 7.5%. Last week’s trade saw a drop of 22.802 or 22.80%. Last week’s bar was also a very large Bearish Engulfment, which is usually not a positive sign, as the name implies. The 50% Fibonacci retracement level is at 75.391. The next support level down would be near 64.411 or the 62% retracement. In a market that’s trading in a “reasonable” manner those would be potential targets for support, but recent trade has been quite “unreasonable” in my opinion. The 5- and 10-week averages (blue/red) are BOTH above the market and offering potential resistance levels. Technically, they’re still in a bullish configuration, and have been since mid-May of 2025. They’re also both still inclined higher, but only slightly on the 5-week. Do you notice how the gap between those two averages has widened since roughly Thanksgiving? That, to me, is a sign of a market that’s getting very overheated and very overbought. The 50-week average (green, 47.302) is well below the market price and inclined higher, offering potential support.
This weekly chart shows me a market that has been in an uptrend since last spring, without any meaningful correction. That’s what we’re seeing now, I think.
In the long run, certainly from a fundamental supply/demand view, conditions are still bullish. I haven’t seen anything to change my mind on that, just yet.
You’ve read this far….how would I suggest you trade it?
Very aggressive and very well-margined traders that want to trade from the long side (buying the market) should wait, I think. I think that there may be more downside ahead. Look for support and potential entry points near the 62% retracement at 64.441. The 100-day moving average near 62.125 may also be a good support or potential entry point. I would lean more toward buying the market on strength or a move higher, rather that trying to pick a bottom or a long entry point. Momentum is on the side of the Bears right now.
Very aggressive and very well margined traders may do well to consider short futures positions. Perhaps the 50-day average near 75.641 would be a good level to consider selling. Market volatility has increased dramatically, so while I would normally recommend a GTC Buy Stop to protect that short position, I think that traders would be better served by using Call Options to manage that risk. If you go that route, make sure you get the position and option Delta correct to adequately protect the futures position. March Silver options expire in 19 days and you’ll likely need more than 1 option to cover 1 futures contract. Call me if you have questions about that. Also given the higher volatility and large swings the market has been making recently, coupled with the fact that I don’t know your account size, capital reserves or risk tolerance, I won’t make specific recommendations for potential risk or profit here in this space.
Traders that are currently long the market and don’t know what to do now should Buy Put Options to protect your downside risk. A GTC Sell Stop would be a “normal” recommendation, but the Silver market has been far from “normal” recently. The market is at a very high level, so the options are very expensive. The last trade for a March 70.000 Put shows at 5.350 on my screen, or $26,750 before your commissions/fees. That’s expensive, I think! You could also sell a March 60.000 put to defray the out-of-pocket expense. The last trade I show on the March 70/60 put spread is 2.900 or $14,500 out of pocket, again before your commissions/fees. The option strategies mentioned in this paragraph should work for speculators that also believe there is further downside ahead.
This market has achieved very high prices in a very short time. The fundamentals are still bullish. The current weakness is needed to re-set the bull market, if you will, but often when commodity markets peak from extreme levels they don’t look back. Long-time futures traders have seen that happen many times, I think.
Sign Up to receive Walsh Trading’s 1st Half of 2026 Market Outlook First Half of 2026 Outlook for the Livestock and Grain markets.
If you like what you’ve read here and would like to see more like this from Walsh Trading, please Click here and sign up for our daily futures market email.
Jefferson Fosse Walsh Trading
Direct 312 957 8248 Toll Free 800 556 9411
jfosse@walshtrading.com www.walshtrading.com
Walsh Trading, Inc. is registered as a Guaranteed Introducing Broker with the Commodity Futures Trading Commission and an NFA Member.
Futures and options trading involves substantial risk and is not suitable for all investors. Therefore, individuals should carefully consider their financial condition in deciding whether to trade. Option traders should be aware that the exercise of a long option will result in a futures position. The valuation of futures and options may fluctuate, and as a result, clients may lose more than their original investment. The information contained on this site is the opinion of the writer or was obtained from sources cited within the commentary. The impact on market prices due to seasonal or market cycles and current news events may already be reflected in market prices. PAST PERFORMANCE IS NOT NECESSARILY INDICATIVE OF FUTURE RESULTS. All information, communications, publications, and reports, including this specific material, used and distributed by Walsh Trading, Inc. (“WTI”) shall be construed as a solicitation for entering into a derivatives transaction. WTI does not distribute research reports, employ research analysts, or maintain a research department as defined in CFTC Regulation 1.71.
/Nvidia%20logo%20and%20sign%20on%20headquarters%20by%20Michael%20Vi%20via%20Shutterstock.jpg)


/Intel%20Corp_%20Santa%20Clara%20campus-by%20jejim%20via%20Shutterstock.jpg)
