Chart of the Day
The information and opinions expressed below are based on my analysis of price behavior and chart activity
Sign Up to receive Walsh Trading’s 1st Half of 2026 Market Outlook First Half of 2026 Outlook for the Livestock and Grain markets.
Tuesday, March 3, 2026
If you like this article and would like to receive more information on the commodity markets from Walsh Trading, please use the link to join our daily email list -Click here
December Corn (Daily)
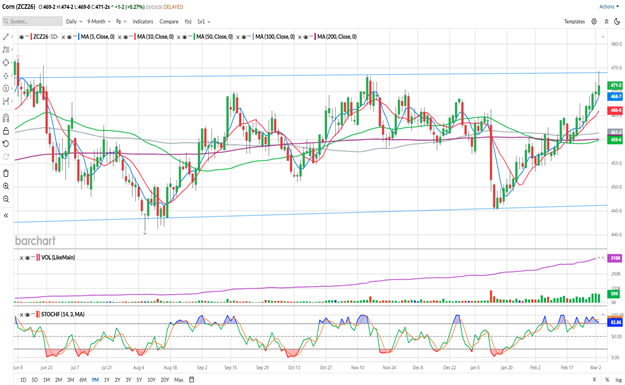
Today, December Corn settled at 4.71 ¼, up 1 ¼ cents on the day. This market has been marching higher for the past 6 weeks or so, following the bearish January USDA report. Today’s close was 3 cents off the daily high and 2 ¼ cents off the low of the day. Even with the recent uptrend, to my eye, today’s trade may give a slight advantage to the bearish side.
Currently, market prices are above all of the moving averages on the chart above. The 5- and 10-day have been in a bullish configuration since January 26th. The 5-day has been tested/violated several times over the past 6 weeks and has held as reasonable support. The 10-day has been tested, as well, but has not been violated by a daily close. Both of those averages are inclined toward higher prices, with the 5-day (blue) at 4.68 7/8 and the 10-day at 4.66. The longer-term moving averages on the chart are the 50- (green), the 100- (grey) and the 200-day (purple) Those are at 4.59 ¾, 4.61 ¼ and 4.60, respectively. They also have a slight inclination to them, but are showing no clear trend. The 200-day has been within 1 cent of the 4.60 mark since mid-October and is basically a flat line, in my opinion. The 50- and 100- day made a bearish cross over on January 27th and are still in a bearish configuration, but with a choppy market condition like the Corn has been in, the longer-term crossovers have had little technical influence, I think. Stochastics (bottom sub-graph) are overbought, currently, but are showing sign of weakness. By my count, over the past 9 months shown on the chart above, this market has spent 22 days being overbought and 20 being oversold. A slight advantage to the bulls, perhaps, but almost a 50/50 split.
You may notice the blue trendlines on the chart. We’re certainly on the high side of that trading channel. If the last 9 months are any guide, there should be some technical resistance near here. The weekly chart below give a longer time-frame look at that channel.
Today’s trade, while continuing the pattern of higher highs and higher lows, may be signaling a short-term top. Bars that look like today’s, with a spike high and closing well off of the highs of the bar, are not usually bullish. To my eye, more often than not, those types of bars or candles appear at the tops of trends, rather than in the middle of it.
The Corn market hasn’t really reacted much to the US attacking Iran, I think. I think this is a very different situation, compared to UKR/RU, as most of the countries immediately surrounding Iran are importers of grain, rather than exporting producers like Russia and Ukraine. Unless this drags on for longer than anticipated, or accelerates somehow, I think the effect on Corn prices will be negligible.
Recent news from the USDA’s Ag Outlook Conference, suggests a drop in planted acreage for Corn in 2026. This is a preliminary number, but they pegged a drop from 98.8 million acres in 2025 to 94.0 million in 2026. The next look at acreage from the USDA will be the 31st of March, with the Prospective Plantings report coming out at 11 AM that day. We’ll also get the Quarterly Grain Stocks data at that time. Next week on the 10th, the USDA will release the monthly Crop Production and Supply/Demand numbers.
I think that demand for our record 2025 crop has been very good, with exports above the pace needed to match the USDA’s outlook. Demand for ethanol production has also been robust, although yesterday’s Grain Crushings report showed a mild decrease of 2% when compared to usage/consumption last January. The US Dollar has been strengthening recently, which could slow some export sales, but today there were another 196,000 MT sold to an “unknown” destination in a flash sale announcement.
Competition from South American Corn is on the horizon, with recent estimates for Brazilian production ranging from 136-142 million tons. They still have most of the safrina growing season to get through. So weather will remain a factor.
We just finished the month of February, when Crop Insurance levels are set for both Corn and Soybeans. This year’s 4.62 level for Corn is 7 ½ cents lower than last year. FYI, the Soybean insurance price improved by about 57 cents.
We haven’t planted anything here in the US, to my knowledge, and we have a whole crop season in front of us. A lot can happen between now and harvest. But if you recall last year, once the insurance price was set, producers only got 1 more chance, on April 16th, to hedge Corn near those levels. I think it might be a good idea for farmers to protect against a repeat.
Producers may do well to consider hedging a portion of their intended production at this time. I would suggest December Put Options. Those expire in 262 days. December 460 Puts settled at 25 ¾ cents today, or $1,287.50 per option, before your commissions/fees. The delta on that strike price is -0.43, so you’ll need at least 2 or more options to adequately cover 5,000 bushels of Corn. If that’s too much to spend, consider selling the 420 Puts to create a spread and lower your out-of-pocket expenses. The 420 Put settled at 10 cents today. If you can buy those December 460/420 spreads for 15 cents, that lowers your cost to $750 per spread, before your commissions/fees. My suggestion is to have no more than 20% of your intended crop production hedged at this time.
December Corn (Weekly)
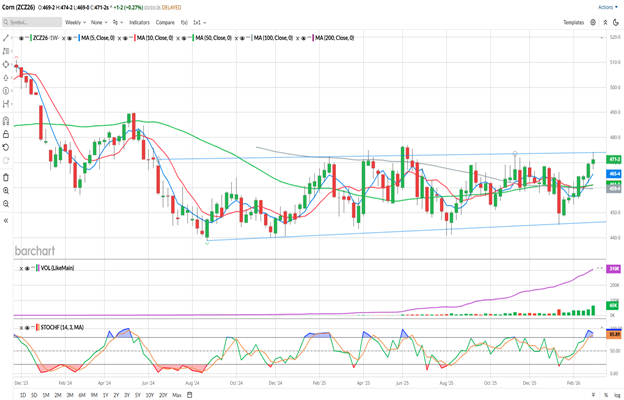
So far this week, December Corn is up 1 ¾ cents. Not a huge gain, but a gain nonetheless. To my eye, the trading channel is much clearer on the weekly chart. All of the technical indicators on this chart are in a bullish configuration, at the moment. But like the daily view above, the 50- and 100-week trends are nearly flat. The 50- and 100-week averages made a bullish crossover in mid-December. The weekly view also suggests that an upside breakout is possible. We’ve bumped into this price range 5 times over the past year and that history suggests weakness ahead. However, experience tells me that eventually the market will break out, one way or the other. Either an outside demand event (China??) or a weather surprise (drought) could do it to the upside, with a potential downside break out caused by economic stress (recession, govt intervention) or a great weather season like we had last year.
You can view Barchart’s seasonal data here.
Sign Up to receive Walsh Trading’s 1st Half of 2026 Market Outlook First Half of 2026 Outlook for the Livestock and Grain markets.
If you like what you’ve read here and would like to see more like this from Walsh Trading, please Click here and sign up for our daily futures market email.
Jefferson Fosse Walsh Trading
Direct 312 957 8248 Toll Free 800 556 9411
jfosse@walshtrading.com www.walshtrading.com
Walsh Trading, Inc. is registered as a Guaranteed Introducing Broker with the Commodity Futures Trading Commission and an NFA Member.
Futures and options trading involves substantial risk and is not suitable for all investors. Therefore, individuals should carefully consider their financial condition in deciding whether to trade. Option traders should be aware that the exercise of a long option will result in a futures position. The valuation of futures and options may fluctuate, and as a result, clients may lose more than their original investment. The information contained on this site is the opinion of the writer or was obtained from sources cited within the commentary. The impact on market prices due to seasonal or market cycles and current news events may already be reflected in market prices. PAST PERFORMANCE IS NOT NECESSARILY INDICATIVE OF FUTURE RESULTS. All information, communications, publications, and reports, including this specific material, used and distributed by Walsh Trading, Inc. (“WTI”) shall be construed as a solicitation for entering into a derivatives transaction. WTI does not distribute research reports, employ research analysts, or maintain a research department as defined in CFTC Regulation 1.71.


/Micron%20Technology%20Inc_%20logo%20on%20building-by%20vzphotos%20vis%20iStock.jpg)