




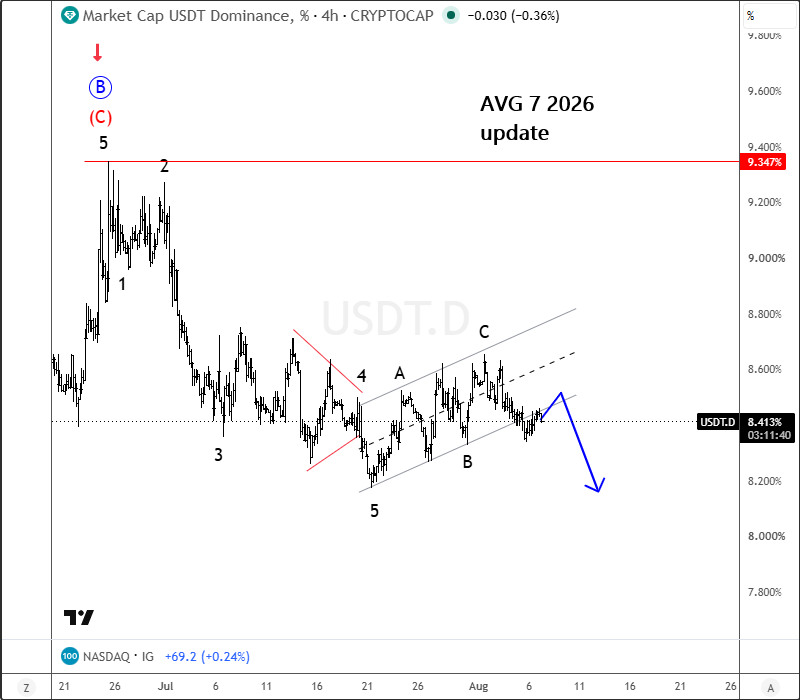
One of the most important charts from earlier this month and earlier in August is definitely USDT dominance. Notice that price is coming lower quite aggressively, as expected as shown below.
Update
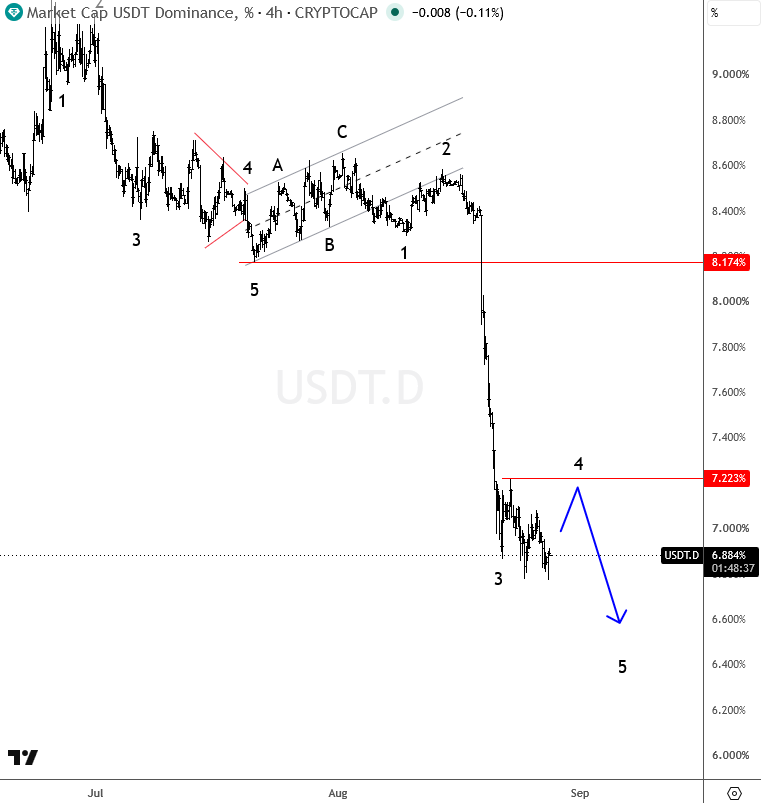
We indeed have impulsive characteristics here since the market broke beneath 8.17%, and now it looks like there can be room for even more weakness. However, it’s possible that we are in wave four now, meaning more weakness could be seen after some potential sideways price action in the near term. There is important resistance around 7.2%.
| Join the community for one week, full access. Its free >> @ wavetraders.com/elliott-wave-plans/ |
What about Bitcoin?
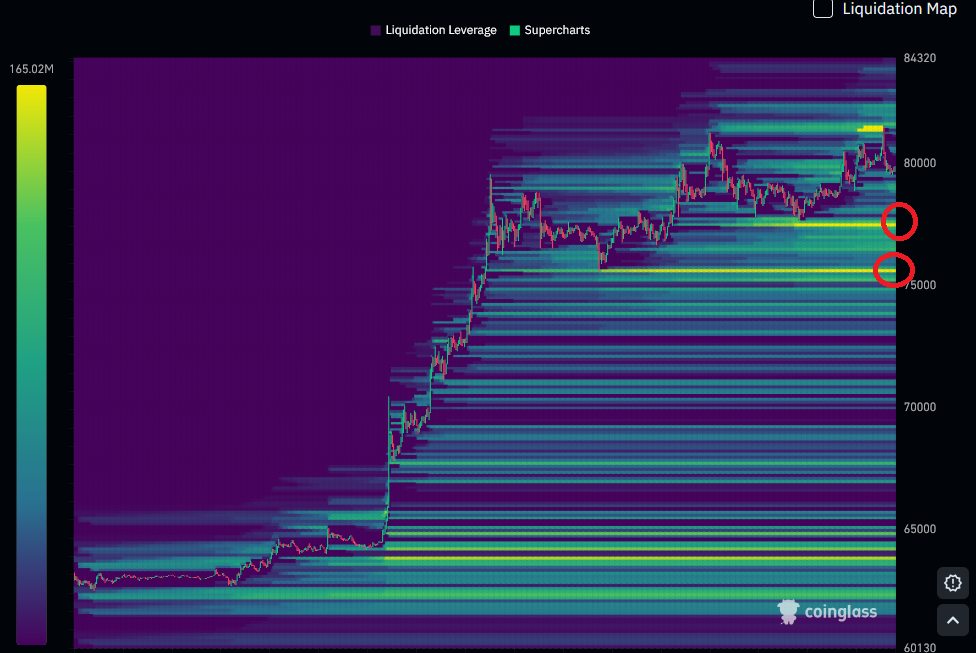
The longer price is consolidating, the more orders will start building around swing highs and swing lows, which usually helps us identify key support and resistance levels. Now, if we look at the latest liquidation map of perpetual contracts, meaning those that do not expire, it shows that there are a lot of orders sitting around 77,500, and a bit lower we have more orders around 75,500. So, of course, we always see these areas as interesting potential magnets, and once those orders are executed, meaning stops are collected, that’s when we could expect a rebound. This perfectly fits the Elliott Wave structure that we are watching. For full chart analysis and market update apply for a 7 day full access.
GH


/AI%20(artificial%20intelligence)/Ai%20chip%20by%20Quality%20Stock%20Arts%20via%20Shutterstock.jpg)

/A%20close-up%20of%20the%20Broadcom%20logo%20on%20a%20smartphone%20by%20Timon%20via%20Adobe%20Stock.jpeg)
