The month of February will see a number of key fundamental factors come into play for the global soybean market including the bulk of Brazil's harvest and China's New Year holiday.
As for the US market, reads on real supply and demand have been growing more bearish heading into February.
Meanwhile, funds continue to hold a net-long futures position, leaving the market vulnerable to increased pressure from long liquidation.
As I mentioned in Monday’s (February 2, 2026) Morning Commentary, the turn of the calendar page to February marks the beginning of the Dog Days of Winter in North America, the Dog Days of Summer south of the equator. (For the record, August is called the Dog Days of Summer up north, and given seasons are six months different between north and south, February equals August and vices versa.) And given Brazil is the world leader in soybean production and exports, while Argentina leads the league in soybean meal exports, February is a key month for the US soybean market as well. This is fitting as well, for as the old saying goes, “The soybean crop is made in August”, or February, depending on where one is in relation to the equator.
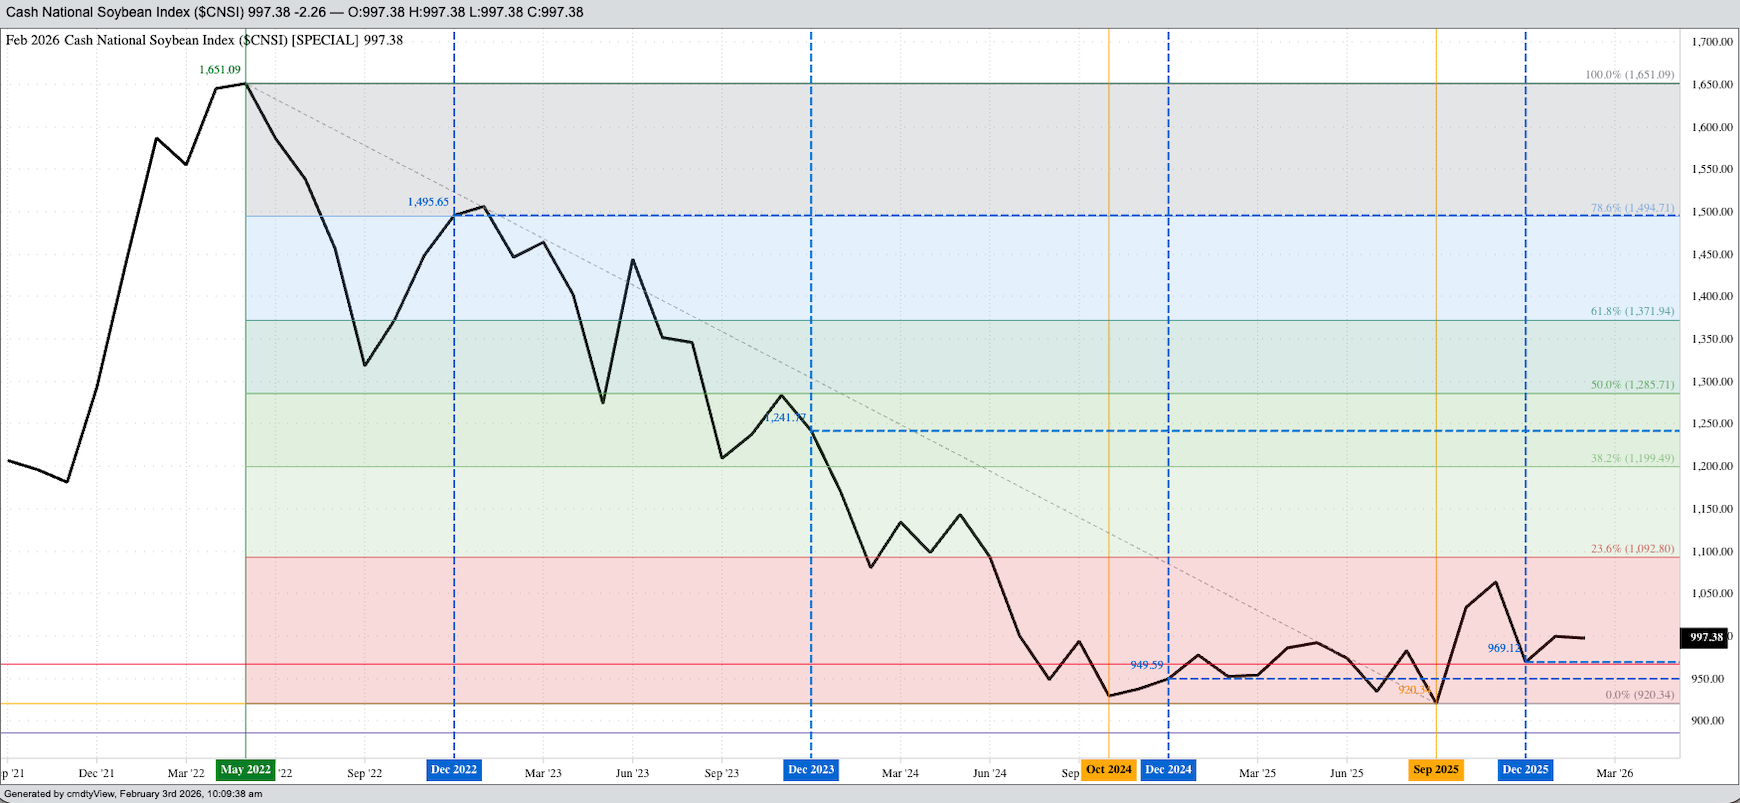
Let’s take the US market apart one piece at a time, starting with its intrinsic market value the National Soybean Index ($CNSI). At the end of the January the Index was priced at $9.9964, holding above its previous 5-year low end of January price of $9.7761 from 2025. But not by much. Based on the Law of Supply and Demand, this means US available supplies were the second largest in relation to demand for those supplies over the past 5 years. If not for a manufactured rally in the US soybean market last fall, based on false headlines of “deals” between the US and China, it doesn’t take much to imagine the Index would still be running below the previous 5-year end of month lows as it was through last September. From a technical point of view, the key price once we get toward the end of the month is the recent low monthly price of $9.6912 from December 2025. A move below that mark, on the monthly close, would indicate the Index could next test its long-term low of $9.2034 from September 2025.
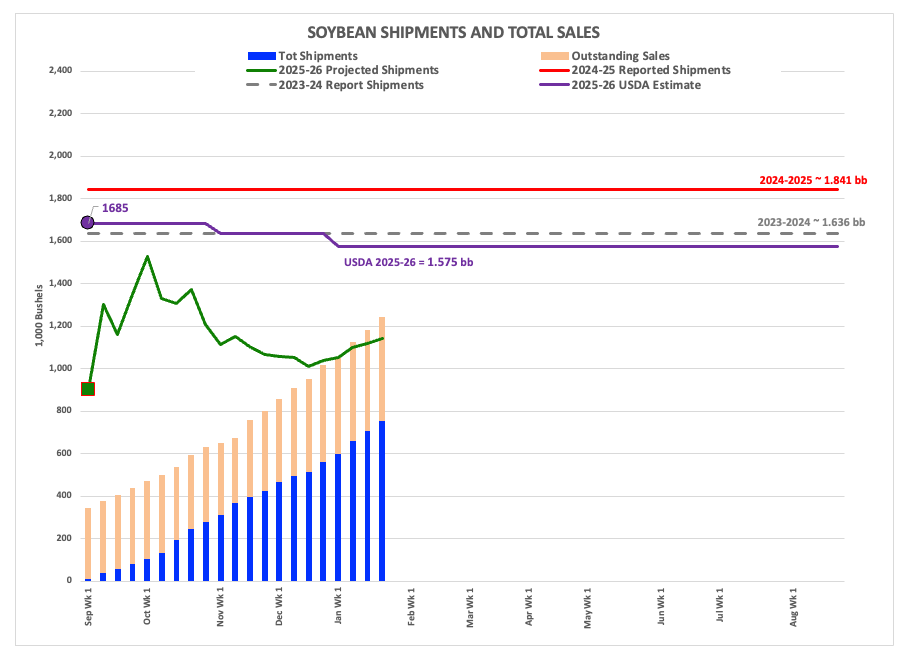
Along with the low price of the Index, the national average basis market has also stayed weak. At the end of January, the calculation came in near 64.5 cents under March futures and 77.25 cents under May. The previous 5-year low weekly close for last week was also about 64.5 cents under March with the previous low weekly close for the first week of March at 81.5 cents under May. The bottom line is basis remains bearish. Why? The latest weekly export sales and shipments update, for the week ending Thursday, January 22, showed th US on pace to ship 1.146 billion bushels of soybeans during the 2025-2026 marketing year, down 38% from last marketing year’s reported shipments of 1.841 bb. Meanwhile, the pace projection for US soybean meal is only up 10% year-over-year while soybean oil is down 54%. As for domestic crush, demand was running about 8% ahead of last year’s pace, meaning an additional 200 mb of soybeans used over last year. While solid, it isn’t enough to offset the roughly 700 mb year-to-year drop in exports.
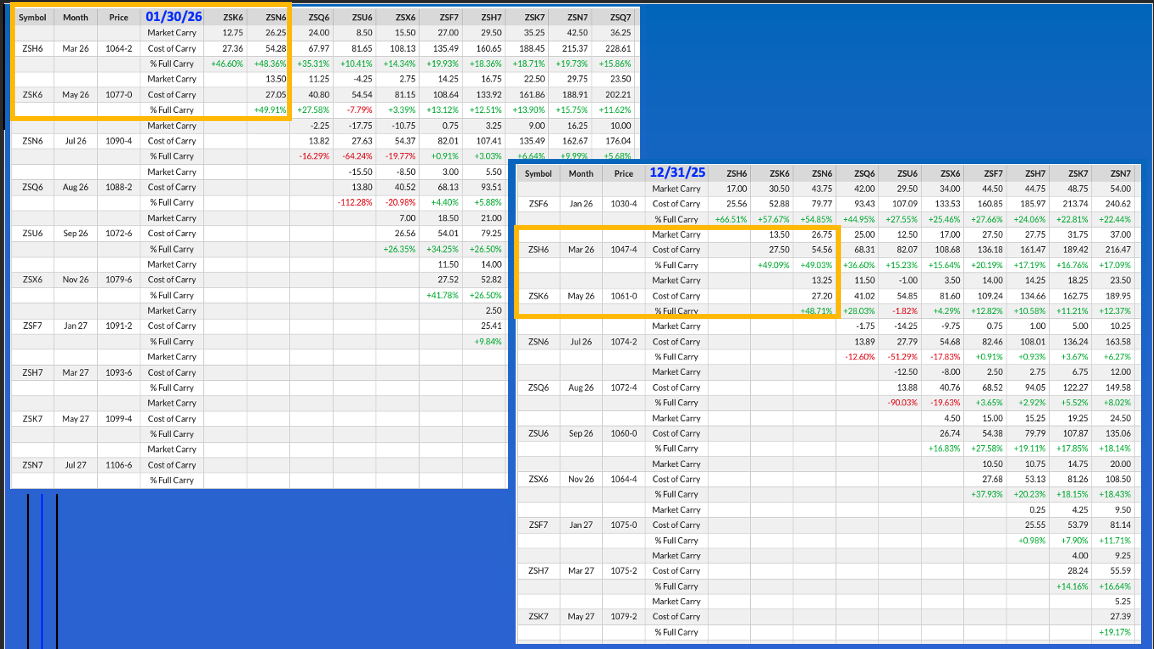
What is the market telling us? At the end of January, the March-May futures spread covered 47% calculated full commercial carry as compared to the end of December’s 49% and the 2025 edition of the spread the same week last year covering 56%. The numbers for the May-July futures spread were 52% (end of January 2026), 49% (end of December 2025), and 53% (end of January 2025). The bottom line is the commercial outlook for US soybeans through the spring of 2026 is about the same as it was last year.
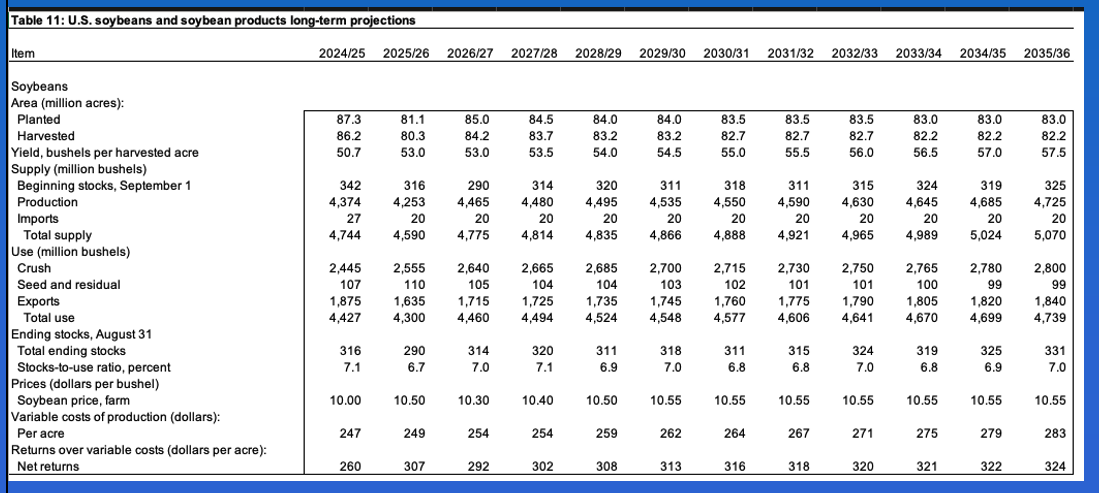
Here’s where things start to get interesting, though. If US supply and demand is roughly the same heading into the 2026 planting season as it was last year, what happens if the US plants more acres to soybeans? Recall from last December in its Baseline report, USDA accountants put 2026 US soybean planted area at 85.0 million acres (ma), up 3.8 ma (4.7%) from the 2025 reported figure of 81.2 ma. (Keep in mind the 2025 number was down 6.2 ma (7.0%) from 2024.) The corn number came in at 95.0 ma, down 3.8 ma (3.9%) from 2025. This would mean while the US is expected to have ample supplies carrying over from this marketing year to next, total production would be projected larger than this past year’s reported 4.262 bb.
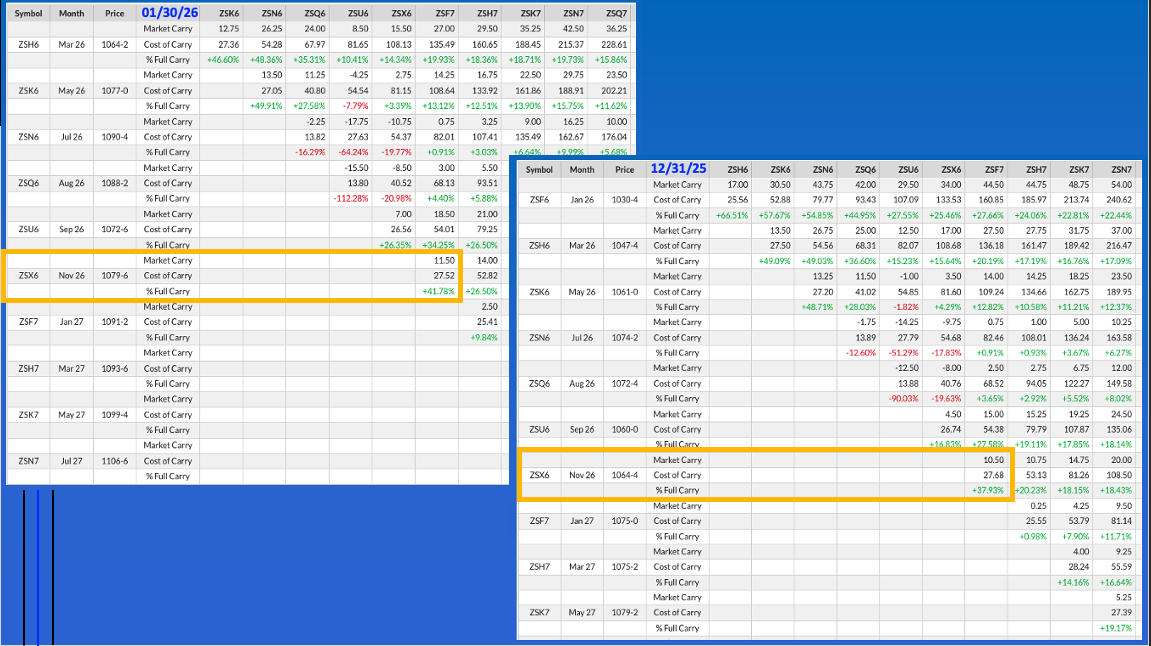
What does the market think? Let’s start with the new-crop Nov26-Jan27 futures spread that covered 42% calculated full commercial carry at the end of January, as compared to the end of December’s 38%. The Nov25-Jan26 spread covered 43% the first weekly close of March 2025 before strengthening to cover 71% the last weekly close of September. Again, the situation looks similar at this time. And while I continue to hear from folks across the Midwest and Plains that there will be more acres planted to soybeans in 2026 due to input costs for corn, the Nov26 soybean/Dec26 corn futures spread still favors corn. Theoretically. At last Friday’s close the spread had a 22-week average weekly close of 2.34. Of the previous 10 years, the one closest through 22 weeks was 2022 at 2.33. That year reportedly saw US producers plant 87.5 ma of soybeans, a fractional increase from 2021, and 88.2 ma of corn, down 5.1% from the previous year.
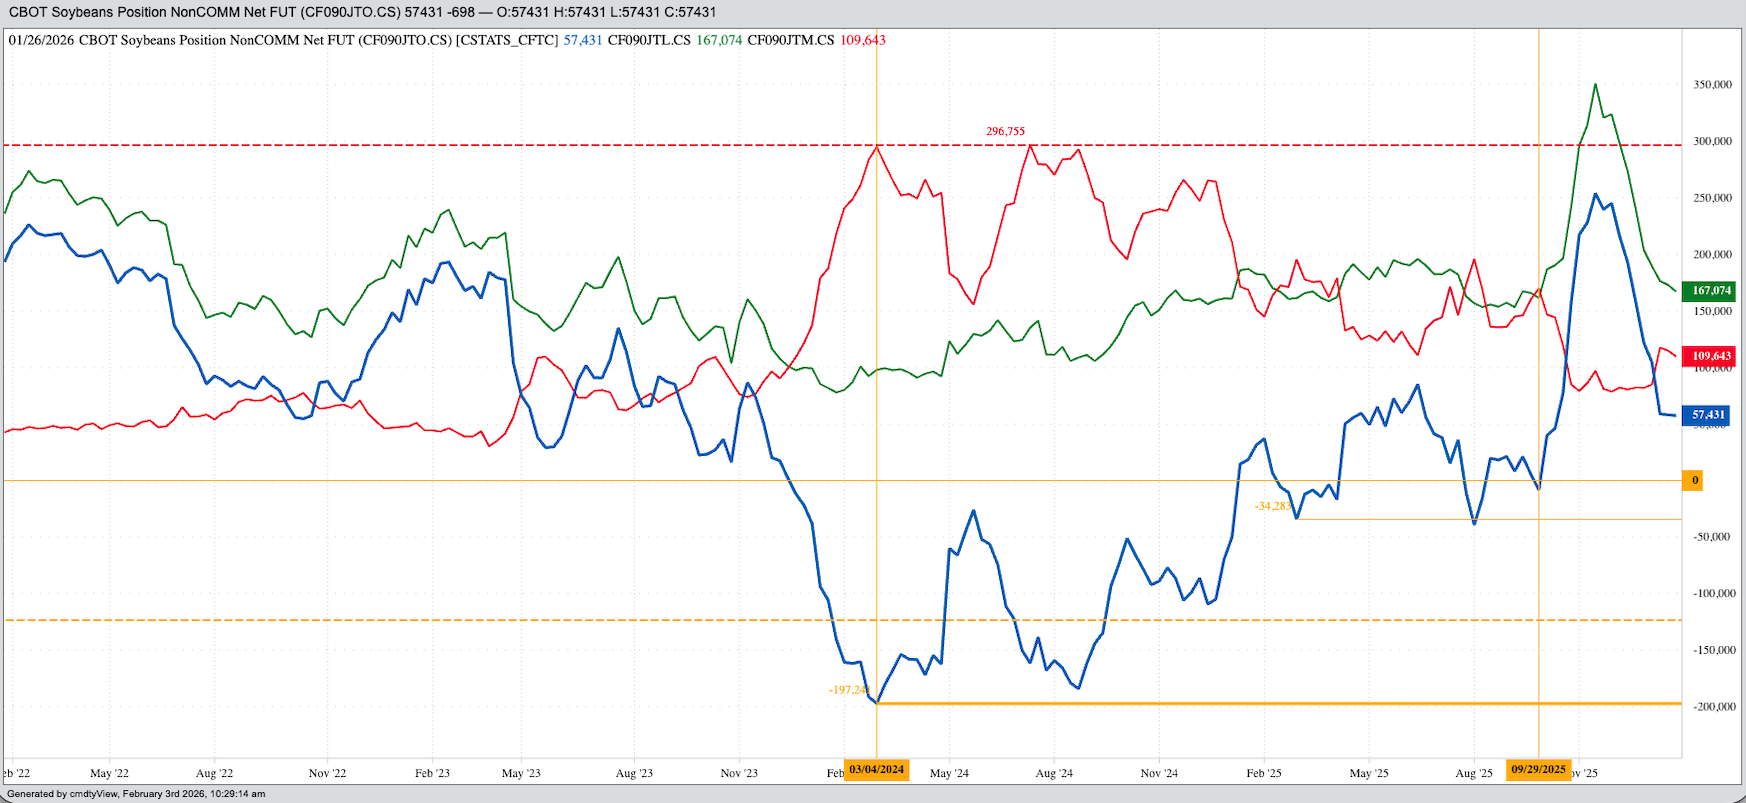
As of this writing, the picture for the US soybean market seems clear. China is waiting to see how Brazil’s harvest does during February, a month that includes China’s weeklong New Year Holiday, before committing to ship the 226 mb of US soybeans it held on the books as of January 22. If we see futures spreads, both old-crop and new-crop, start to cover more calculated full commercial carry we will have a good idea those bushels are not going to be taking a boat ride to China. Watson will see this as well, meaning some, or all, of its net-long futures position of 57,430 contracts could be liquidated. And if both sides of the market are selling, commercial and noncommercial, the end result is easy to guess.
Let’s see how February plays out.
On the date of publication, Darin Newsom did not have (either directly or indirectly) positions in any of the securities mentioned in this article. All information and data in this article is solely for informational purposes. For more information please view the Barchart Disclosure Policy here.

/Micron%20Technology%20Inc_%20logo%20on%20building-by%20vzphotos%20vis%20iStock.jpg)

/AI%20(artificial%20intelligence)/AI%20engineer%20working%20on%20laptop%20by%20ART%20STOCK%20CREATIVE%20via%20Shutterstock.jpg)
