
While the financial publication industry exploded with content regarding the potential popping of the gold and silver bubble, you’ll notice that early in the week, I issued a bearish story on gold mining juggernaut Newmont (NEM). I’m not here to say that I have some special insight into how securities behave because that would be absurd. However, I mention NEM stock because it gave two clear signals that something wasn’t right.
First, the volatility skew — which identifies implied volatility (IV) or a stock’s potential kinetic output across the strike prices of the same expiration date — of various options chains demonstrated the hedged nature of the gold miner. Essentially, traders wanted upside optionality but preferred the exposure synthetically instead of via actual ownership of NEM stock.
Also, while call IV was ultimately elevated at the lower strike prices (thus demonstrating hedged bullishness), put IV also skewed upward, creating a half-smile on the chart. Again, this dynamic points to the hedging involved. While traders were optimistic about NEM stock, the bullishness wasn’t free and naked. Instead, the optimism was layered in complex transactions, which clued us into what the smart money was really thinking.
Second, the quantitative picture for NEM stock was not at all inviting. At the time of my analysis, NEM enjoyed a long streak of upside. However, I used a second-order inductive analysis integrated with Markov transitions to estimate likely outcomes. In a way, I used Black-Scholes on the Black-Scholes to filter a range of possibilities into a narrower list of probabilities.
To make a long story short, Black-Scholes assumes a parametric world where most stock prices should fall within one standard deviation of the spot price (while accounting for volatility and days to expiration). However, this parametric world assumes volatility is an independent input. I’m assuming a Markovian world where volatility is a dependent factor that can color where in the spectrum the target stock is likely to touch ground.
That’s why my model doesn’t necessarily conflict with Black-Scholes; instead, I’m just trying to narrow down the expected move range to probable suspects. With that in mind, here’s a bullish and bearish idea to consider this week.
Rivian Automotive (RIVN)
Rivian Automotive (RIVN) may be one of the more fascinating ideas, if only because intrepid contrarians will almost certainly view it as a discount. Since the start of the year, RIVN stock dropped more than 25%. Of course, simply buying a security because it fell is hardly a good strategy. But with Rivian, the smart money has positioned itself in an intriguing manner.
First, volatility skew for the March 20 expiration date shows put IV curving sharply upward at the lower strike prices. To be clear, this doesn’t mean that traders are piling into $5 puts. However, the increased demand for downside volatility protection has created a surface level distortion, leading to a half-smile in the volatility chart.
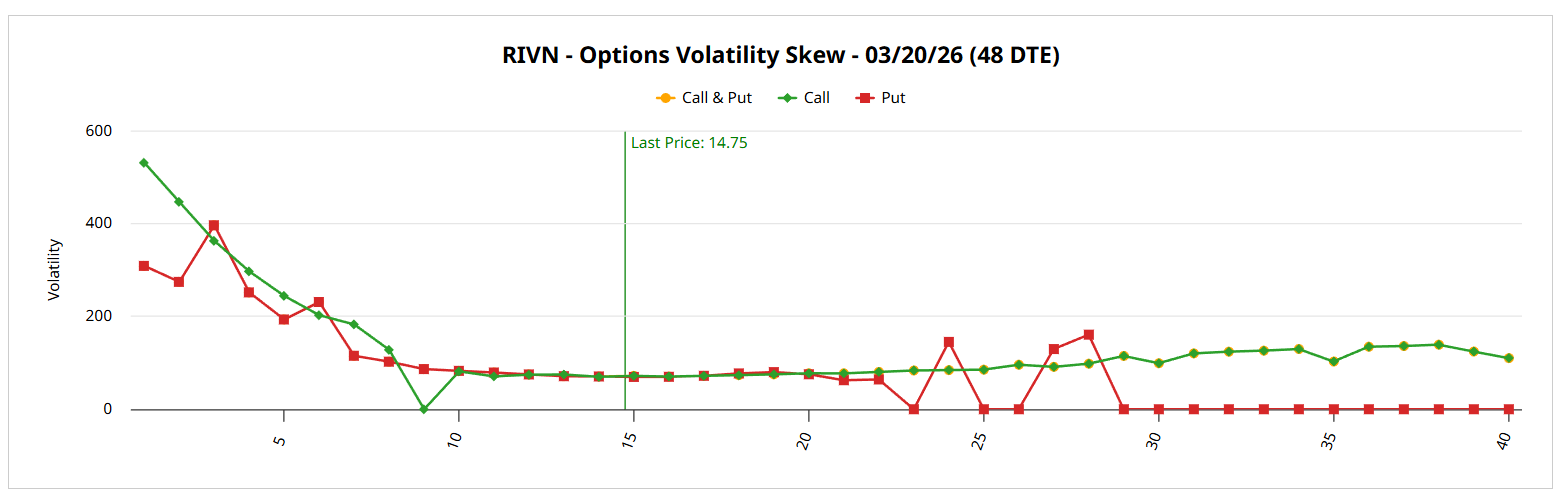
However, the main takeaway is that call IV is more elevated than puts at the lowest strike prices. Further, call IV is relatively elevated compared to the put equivalent at the upper boundaries. This setup signals that while sophisticated market participants are hedging heavily against downside volatility, they’re also positioned for upside optionality.
Volatility skew is one of the most important yet underrated tools under Barchart Premier. Essentially, the skew broadcasts the amount of volatility insurance that smart money traders are willing to pay.
Another point to consider is that quantitatively, RIVN stock has printed four up weeks in the past 10 weeks. Using a Bayesian-lite inductive model, we can estimate that probability mass may coalesce over the next 10 weeks between $15 and $16.
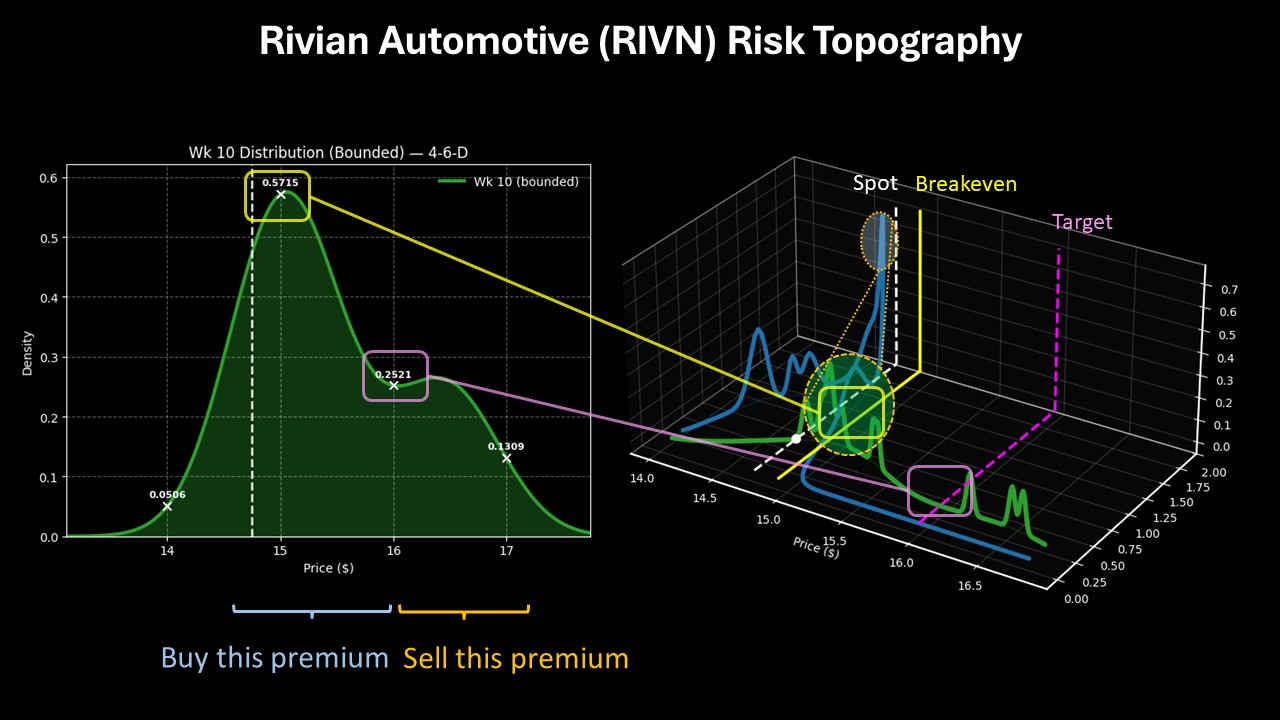
With the available data at hand, I’m liking the 14/16 bull call spread expiring March 20. Should RIVN stock rise through the $16 strike at expiration, the maximum payout would be nearly 113%. Breakeven lands at $14.94.
Teva Pharmaceutical (TEVA)
On the other end of the spectrum, there doesn’t seem to be any stopping Teva Pharmaceutical (TEVA). Since the beginning of January, TEVA stock has gained over 9%. However, the real story is that, in the past six months, the security has gained roughly 121%. Various technical indicators are flashing as a Strong Buy, which presents a major concern.
With so much enthusiasm baked into the generic drugmaker, the trade has become overcrowded. What’s more problematic, the smart money has noticed — and is taking action accordingly.
For the March 20 options chain, Teva’s volatility skew shows elevated put IV at the lower strike prices. Further, while the skew is relatively flat in the upper boundaries, it should be noted that put IV also rises above calls. Quite clearly, this dynamic communicates to us that the predominant emotion is downside insurance. Also, the elevated puts at the upper strikes may symbolize mechanical short positions, possibly to protect actual long exposure.
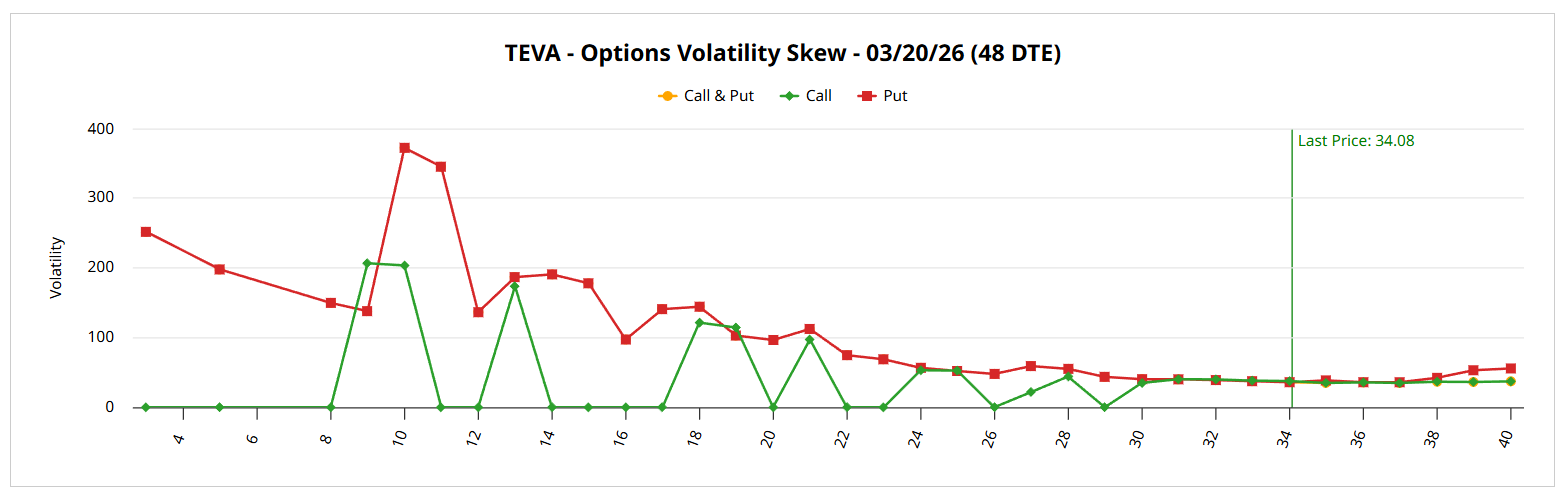
However you parse the nuances, the smart money clearly sees downside volatility as a very real scenario. That’s why I’m against the idea of “this time it’s different.” The most sophisticated market participants simply don’t agree.
On the quantitative front, I am concerned that TEVA stock has printed an 8-2-U sequence. Using a combination of enumerative pattern identification and Bayesian-lite estimation, the likely range over the next 10 weeks is between $30 and $36. Under 8-2-U conditions, most of the probability mass will likely fall south of the spot price.
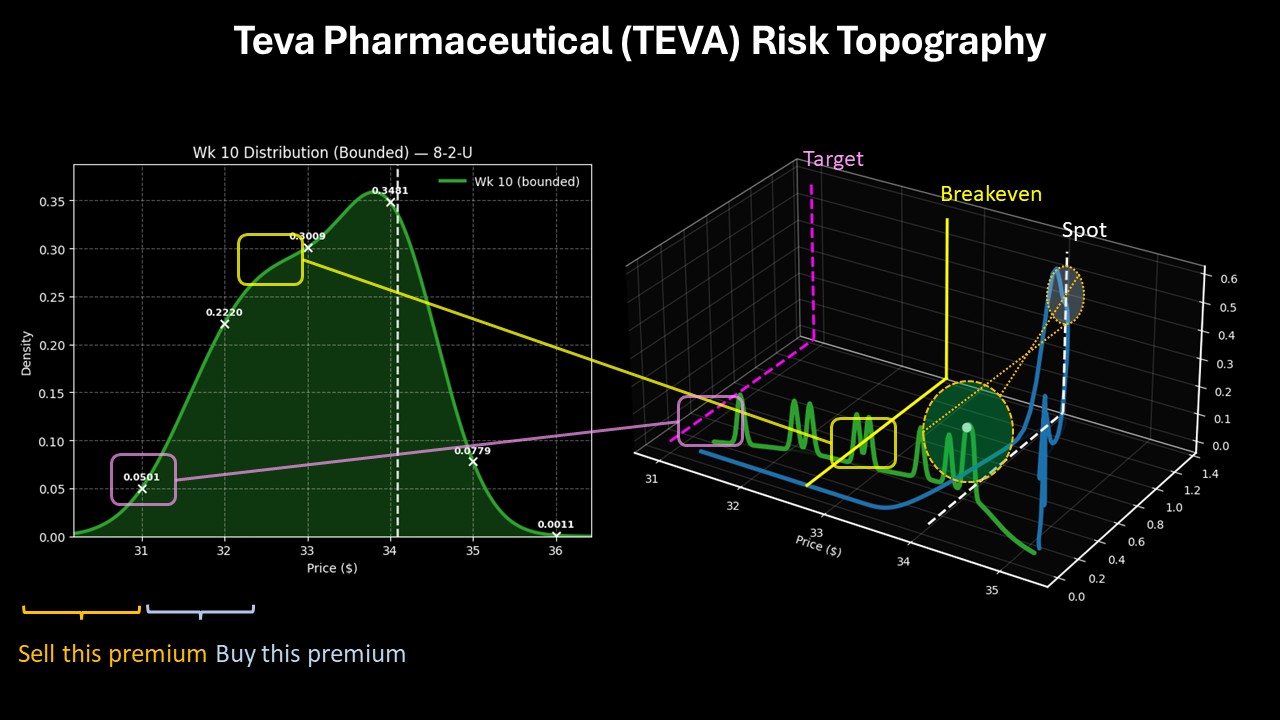
Given the historical tendencies, the 34/31 bear put spread expiring March 20 could be intriguing. If TEVA stock falls through the $31 strike at expiration, the maximum payout would be roughly 126%. Breakeven lands at $32.67.
On the date of publication, Josh Enomoto did not have (either directly or indirectly) positions in any of the securities mentioned in this article. All information and data in this article is solely for informational purposes. For more information please view the Barchart Disclosure Policy here.


/An%20image%20of%20a%20Tesla%20humanoid%20robot%20in%20front%20of%20the%20company%20logo%20Around%20the%20World%20Photos%20via%20Shutterstock.jpg)
/Broadcom%20Inc%20HQ%20photo-by%20Sundry%20Photogrpahy%20via%20iStock.jpg)
/AI%20(artificial%20intelligence)/3D%20Graphics%20Concept%20Big%20Data%20Center%20by%20Gorodenkoff%20via%20Shutterstock.jpg)