
Newmont (NEM) might not be the most exciting gold play out there but as the mining sector juggernaut, its robust performance has been nothing short of remarkable. January hasn’t even crossed the finish line but NEM stock is already up over 26% on a year-to-date basis. With a supply crunch stemming largely from both monetary and industrial demand, the fundamental narrative seems incredibly bullish.
Long term, Newmont probably has room for growth and you certainly don’t want to short this incredible name. Short term, I’m seeing evidence of a frustrating — albeit temporary — lull that could potentially materialize, and one that just might allow fair-weather bears to scalp a quick profit.
This is the internet so let me clarify. Over the next few years, if you had to guess whether NEM stock would be above or below the current market price of $125.92, my money would be on the positive side of the spectrum. That said, the stock market is non-ergodic so there will be pockets of downside that go against the prevailing upside trend.
If you’re willing, you can place a capped-risk, capped-reward bear put spread on NEM stock in anticipation of downward-tilted non-ergodicity. Let me walk you through the evidence because I believe you’ll find it quite compelling.
Volatility Skew Gives Up the Farm for NEM Stock
One of the most important metrics to consider is Barchart’s volatility skew. This screener showcases implied volatility (IV) or the expected kinetic movement of the strike price spectrum for a selected options chain. Across several expiration dates, what we find is that call IV is priced higher than put IV, particularly in the lower strike prices.
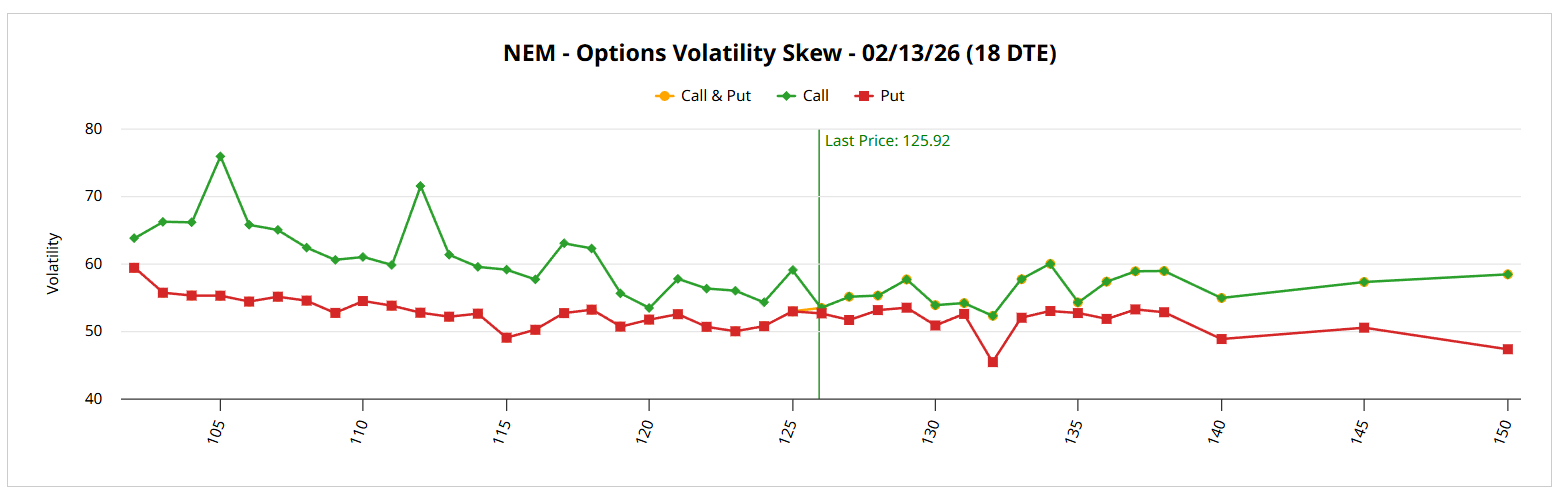
What does that symbolize? Essentially, the smart money is prioritizing upside convexity over downside protection. While they don’t want to outright own the security (perhaps for fear of a sharp correction), they do want the optionality of upside — and are willing to pay a hefty premium for it. What it boils down to is that call options are very expensive on a volatility basis due to the crowded nature of the trade.
Bringing more volume to the bullish position is the backwardation of the silver price. While Newmont is primarily a gold producer, the market tends to respond to precious metals as a broader complex. So, with intense demand lighting up for silver, this has had natural spillover effects on gold and NEM stock. That’s great for longtime shareholders but for those just entering the space, there is risk involved.
Basically, the kind of acceleration that we’ve witnessed tends to compress future returns in the short run. Even though the long-term thesis commands robust credibility, the market often pauses to digest gains, thereby leading to occasional ‘potholes’ in the technical chart.
Targeting some of these temporary undulations could invite profit-extraction opportunities.
Another important point is the unusual options activity screener. Currently, the smart money is positioning most of its trades around the current spot price. Generally speaking, sophisticated market participants hedge the price zones that have attracted anxiety or skepticism. As such, the posture is one of risk management — not aggressive speculation in either direction.
Again, this dynamic speaks to the overall theme of upside convexity. Traders are generally bullish but because this bullishness is hedged, it’s no longer “free” in volatility terms. So, if temporary downside materializes, the risk is that — because convexity is already owned — small pullbacks may cause hedgers to relax protection. In addition, volatility sellers may emerge and option premiums may bleed, creating a short-term corrective cycle.
Notably, we’ve seen such temporary corrections for NEM stock in late October so the point isn’t controversial. I'm just saying it could happen again.
Structural Framework for Newmont Stock Flashes a Gentle Warning
Given the heightened spotlight on the gold miner, it’s no surprise that the Black-Scholes model is signaling a fairly wide dispersion. For the Feb. 6 options chain, Newmont stock could potentially land between $117.68 and $134.17, which represents a 6.55% high-low spread from the current spot price.
While instructive, this dispersion provides us with the expected forecast if NEM stock symmetrically fell within one standard deviation of the spot price (while accounting for volatility and days to expiration). However, we want to try to narrow this range down to understand what may be likely and we can accomplish this through a second-order analysis using the Markov property.
Under Markov, the future state of a system depends entirely on the current state. In other words, forward probabilities should not be calculated independently but instead be assessed under context, which may influence forward pathways. To use a simple sports analogy, a 20-yard field goal attempt is considered an easy three points. Add the context of snow, wind and playoff pressure and the odds may change quite dramatically.
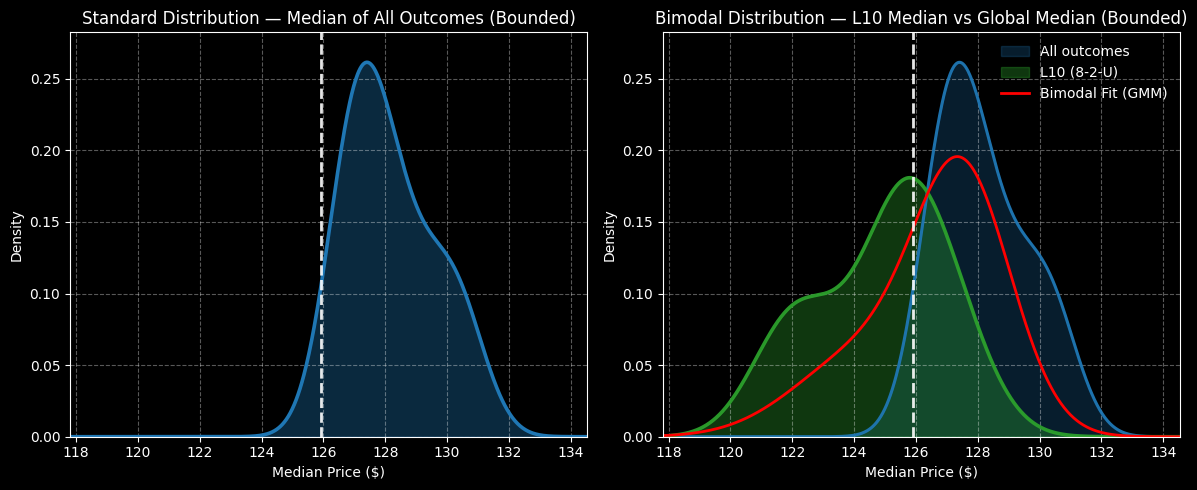
What is the current context of NEM stock? It’s arriving to us having printed eight up weeks in the last 10 weeks, leading to an overall upward slope. Under this 8-2-U sequence, we would expect NEM to range between $118 and $132, with probability density peaking around the current spot price.
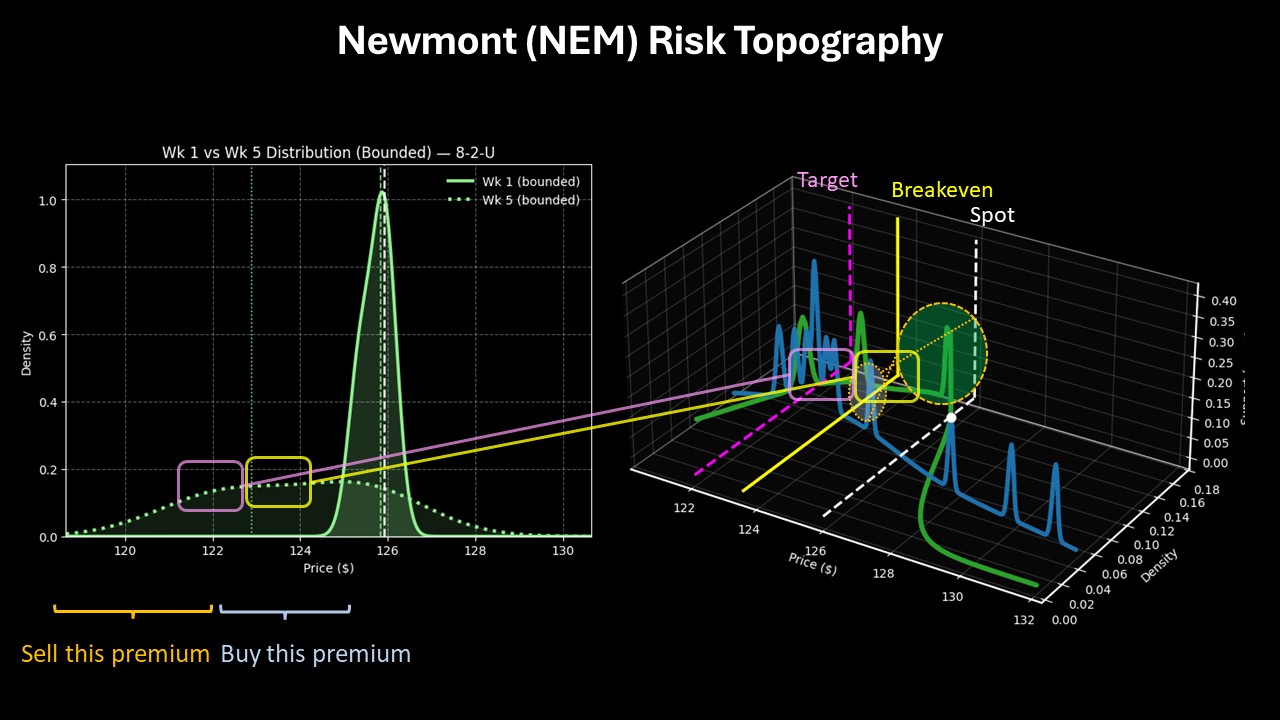
However, over the next five weeks, what’s fascinating is that NEM stock — under 8-2-U conditions — tends to shift negatively, with median projections ranging between $118 and $128. After time, NEM reverts back to the spot price, which tells me one thing: we might be able to take advantage of a possible expression of non-ergodicity.
It’s risky but I’m liking the idea of the 125/122 bear put spread expiring Feb. 6, 2026. If NEM stock falls through the $122 strike at expiration — which is not an inconceivable outcome — the maximum payout would be over 101%. A breakeven price of $123.51 adds a touch more probabilistic credibility to the trade.
On the date of publication, Josh Enomoto did not have (either directly or indirectly) positions in any of the securities mentioned in this article. All information and data in this article is solely for informational purposes. For more information please view the Barchart Disclosure Policy here.


/Alphabet%20(Google)%20Image%20by%20Markus%20Mainka%20via%20Shutterstock.jpg)

/Palo%20Alto%20Networks%20headquarters%20campus%20exterior%20of%20cybersecurity%20company%20By%20MichaelVi.jpeg)