
Another great day for those that bought silver for the investment and insurance parts of their capital. Silver soared, while gold and miners paused – and perhaps topped.
The silver-miners spread continues to work. Silver is up by 3% at the moment of writing these words while the GDXJ is up by less than 1%.
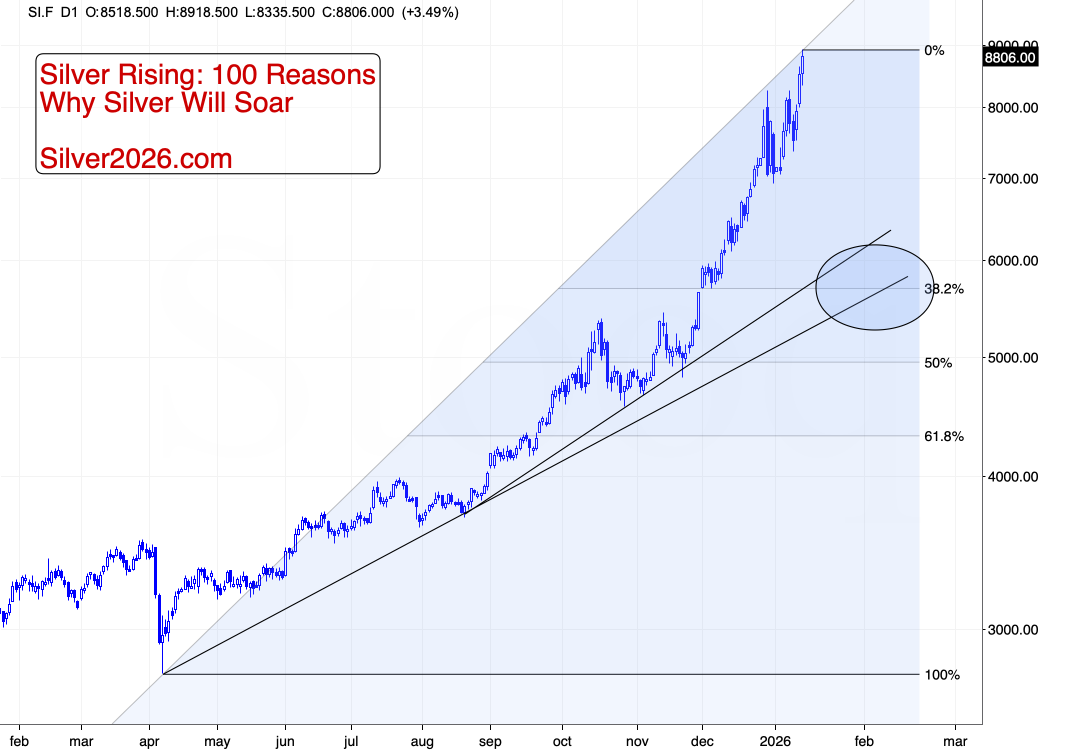
Silver’s intraday high was $89.18 – a price unthinkable just several months ago. We’re witnessing a historic breakout in silver and – what’s even better - we’re positioned to benefit from it.
And when the precious metals sector finally declines, we’ll be ready as well, as miners are likely to decline more than silver given latter’s physical tightness.
While I was typing the above, miners already decline and are now barely up (gold is down by 0.3%). It seems that they have reversed very close to their all-time high, like I had indicated yesterday.
---
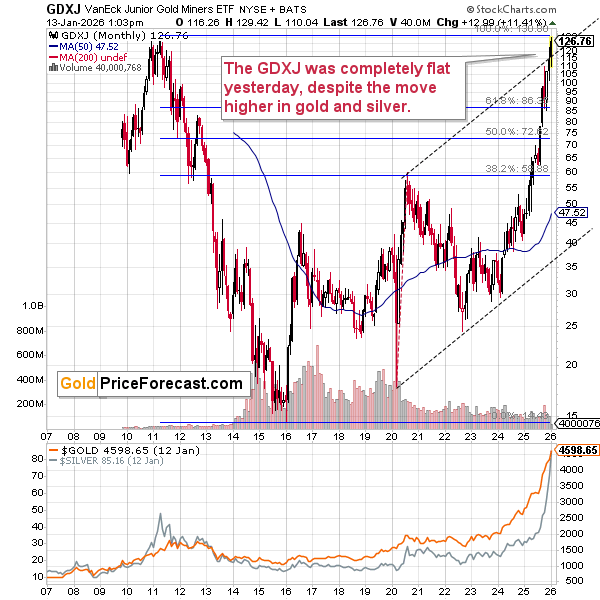
On a side note, if you've been wondering why the GDXJ chart that you can see here (provided by StockCharts.com) shows the top at about $127 while the GDXJ chart provided elsewhere, for example on investing.com shows the top at about $179, here's the explanation:
The difference comes down to how each platform handles dividend adjustments. StockCharts.com is unique among major charting platforms in that it adjusts historical prices for both stock splits AND dividends/distributions. When a dividend is paid, StockCharts retroactively reduces all prior prices by a proportional factor. Since GDXJ has been paying annual distributions since its 2009 inception (15+ years of dividends), this creates a substantial cumulative reduction in how historical peaks are displayed.
Investing.com, on the other hand, follows the industry standard used by most financial websites (including TradingView, Bloomberg, Reuters, and MarketWatch): it adjusts only for stock splits, not for dividends. Both platforms correctly applied GDXJ's 1-for-4 reverse split from July 2013, so that's not the source of the discrepancy. The entire ~40% difference comes from how cumulative dividends are treated.
To put it simply: the ~$179 figure represents what GDXJ actually traded at (on a split-adjusted basis) during its September 2011 peak. The ~$127 figure represents what that same peak looks like after backing out all the dividends that have been paid since then. Neither number is "wrong" - they just answer different questions. The $179 shows pure price history, while the $127 shows something closer to a "total return" visualization.
For those who want to see unadjusted prices on StockCharts, you can add an underscore before the ticker symbol (_GDXJ), which removes the dividend adjustments while keeping the split adjustment intact. That said, I use the dividend-adjusted version in my analyses because it provides a more accurate picture of the relative performance over time - and it's what StockCharts shows by default.
---
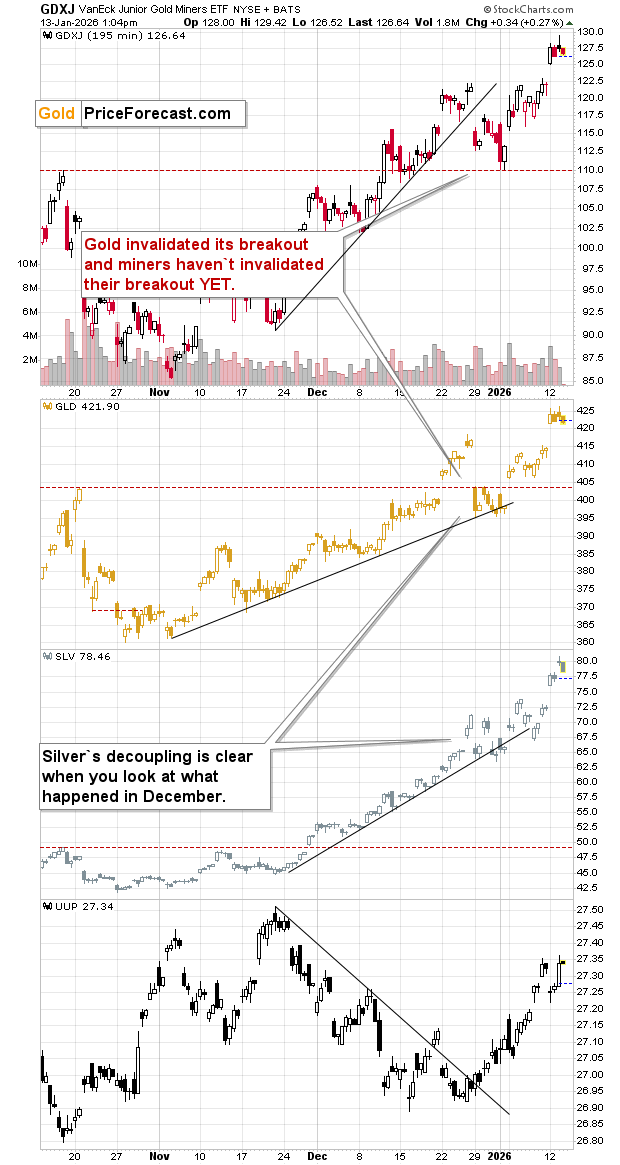
The short-term chart shows the clear intraday reversal – just like the USD Index.
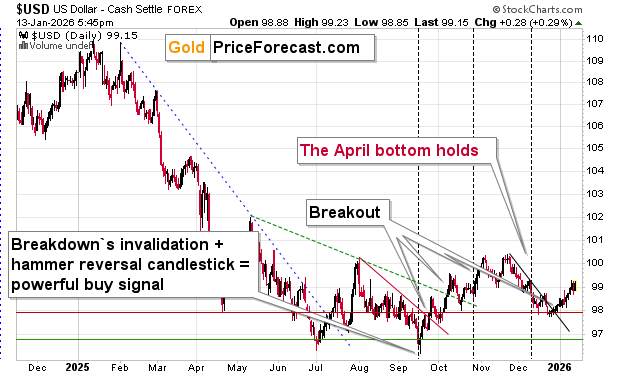
In fact, the USD is up today and it seems that the U.S. currency was able to shrug-off the extraordinary threat to Fed’s independence. This is a very strong proof of USD’s resilience.
It now seems even more likely that the USD Index can decline in the short and medium term despite the fundamental concerns.
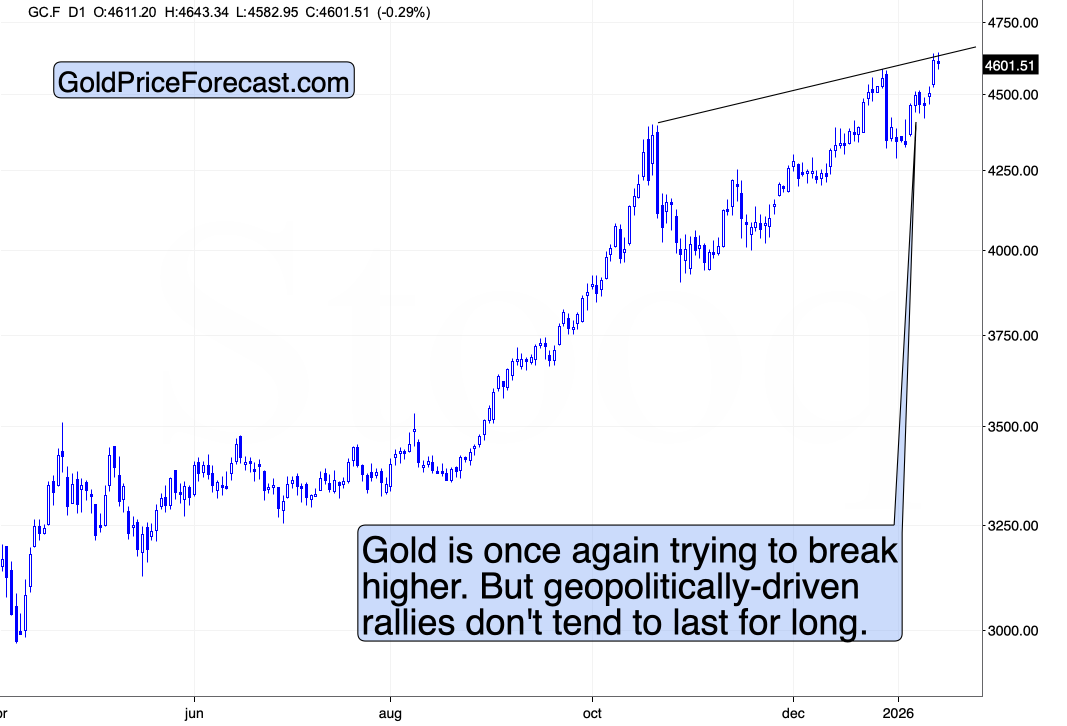
Gold stopped at its resistance line and is now trading around the $4,600 level. This move – just like the move above $4,500 are not confirmed.
Will silver soar even higher given the momentum? If so, it could rally all the way up to $120 before it declines.
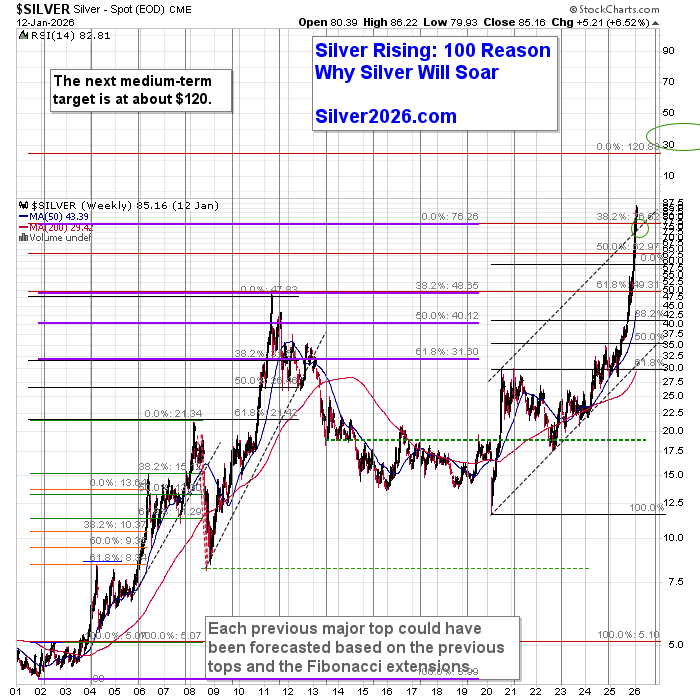
But if the USD Index is starting to rally here and CME is determined to keep raising margins for silver futures, silver is likely to decline before reaching this target – along with the rest of the precious metals sector.
Thank you for reading today’s free analysis. If enjoyed it and would like to get the follow-ups, I encourage you to sign up for my free gold newsletter today.
Przemyslaw K. Radomski, CFA
Founder
Golden Meadow®
P.S. Yes, I know that you are aware of silver's bullish potential, but... do you have a precise exit framework? You might find the top opening sections of this page very interesting.

/AI%20(artificial%20intelligence)/3D%20Graphics%20Concept%20Big%20Data%20Center%20by%20Gorodenkoff%20via%20Shutterstock.jpg)
/Netflix%20on%20tv%20with%20remote%20by%20freestocks%20via%20Unsplash.jpg)


/Apple%20Inc%20logo%20on%20Apple%20store-by%20PhillDanze%20via%20iStock.jpg)