/A%20concept%20image%20of%20space_%20Image%20by%20Canities%20via%20Shutterstock_.jpg)
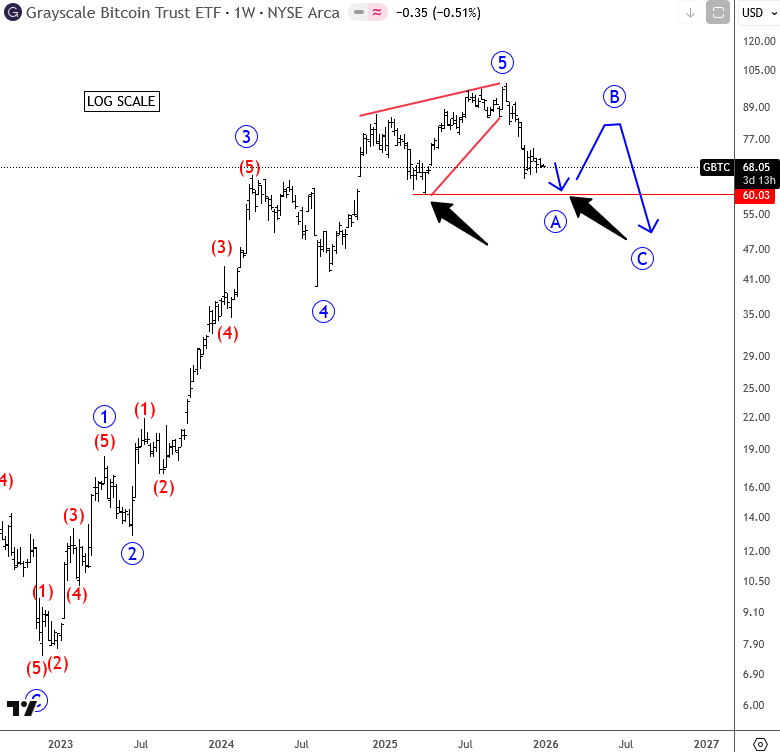
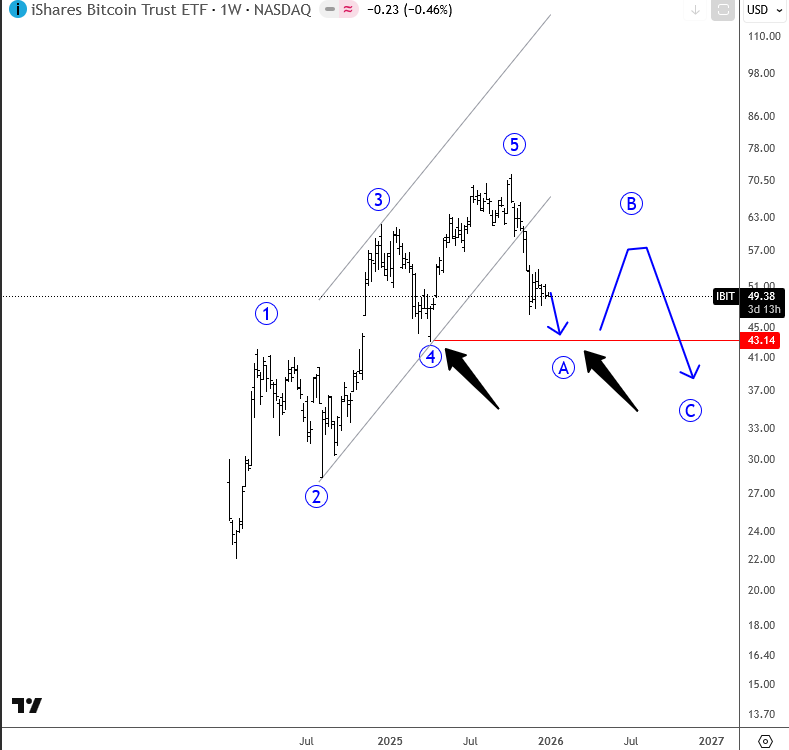
As you can see from both charts, Bitcoin ETFs have recently moved lower in line with Bitcoin itself, and the technical structure on both Grayscale Bitcoin Trust (GBTC) and iShares Bitcoin Trust (IBIT) suggests that a corrective phase is now underway. Importantly, this decline still looks like only the first leg within a higher degree correction, rather than a completed move.
On GBTC, price has rolled over from the upper boundary of an ending diagonal structure, which typically appears late in a trend and often precedes a deeper retracement. The initial break lower from this pattern supports the view that a larger corrective phase has started. From an Elliott wave perspective, the market appears to be unfolding wave A of a higher degree A-B-C correction. If this count is correct, the current decline should eventually find support near the previous fourth wave area, which comes in around the April 2025 lows. This zone is technically important, as fourth wave supports are often revisited during larger corrections.
IBIT is showing a very similar structure, which adds confidence to the overall view. After completing a clear five wave advance, price has broken below its rising channel, signaling a shift in trend. The current move lower also fits well with a wave A decline, rather than a complete corrective structure. As long as price remains below the former channel support and prior swing highs, the bias stays tilted to the downside.
In both ETFs, it is important to stress that corrective phases are rarely straight lines. Even within a broader bearish or corrective environment, we should still expect counter trend rallies. In this case, once wave A completes, a wave B rebound is likely. This rebound could be relatively sharp but should be treated as corrective and temporary, potentially unfolding later as a wave B rally before wave C resumes lower. These rallies often attract late buyers, but they typically fail below prior highs.
Key support to watch on the downside is the April 2025 low region, which aligns well with prior fourth wave support and horizontal demand on both charts. A reaction from this zone would make sense technically and could mark the end of wave A. However, as long as price stays below the recent highs, any bounce should be viewed as part of a larger correction, not the start of a new impulsive uptrend.
We also have published 2026 macro outlook in video format, which you can enjoy with your hot drink right here


/Cisco%20Systems%2C%20Inc_%20magnified%20logo-by%20Pavel%20Kapysh%20via%20Shutterstock.jpg)


/NVIDIA%20Corp%20logo%20on%20phone%20and%20AI%20chip-by%20Below%20the%20Sky%20via%20Shutterstock.jpg)