Chart of the Day
The information and opinions expressed below are based on my analysis of price behavior and chart activity
Thursday, December 11, 2025
March Soybeans
If you like this article and would like to receive more information on the commodity markets from Walsh Trading, please use the link to join our email list -Click here
March Soybeans (Daily)
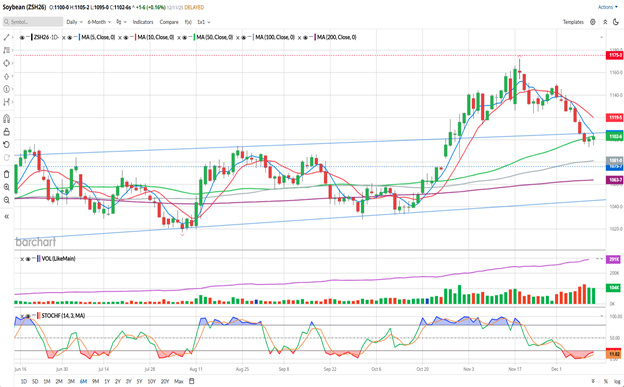
**January Soybeans are still the “front month” as far as daily trading volume goes, but March has eclipsed January according to the open interest**
March Soybeans closed at 1102 ¾ today, up 1 ¾ cents from Wednesday’s settlement. For the past 3 days the market has been trading both sides of the 50-day moving average (green, 1103 ¼) and casting about for support. Wednesday’s low of 1093 ½ was a test of the late-August highs, but failed to maintain the bearish momentum that the market has had for the past 4 weeks or so. The long-term averages on this chart, the 100- and 200-day, (grey/purple, 1081/1063 7/8, respectively) are inclined higher, like the 50-day, and I don’t think they’ll be tested for a while. The 100-day is close to the gap left at 1076 in late-October, but I’m of the opinion that may not get filled for a while, either. The short-term averages, the 5- and 10-day (blue/red, 1104 ¾ and 1119 5/8, respectively) are in a bearish configuration and are both declining, still. The 5-day is close enough to be some resistance, but if traders turn bullish it may not amount to much. Stochastics (bottom sub-graph) are currently in an oversold condition, but does appear to be hooking back higher to my eye. Without counting the days, it seems to me that this market has preferred to be overbought, over this view, rather than oversold.
There wasn’t any material change to the WASDE that was released on Tuesday other than a slight adjustment to the ending stocks. I would expect the January WASDE to show changes to the yield and the overall demand. China is still the talk of the trade, as there’s been little in the way of trade deals and the US Govt continues to move the goalposts on when they expect any purchases to be completed. Last I heard, the US statement was “by the end of the growing season” which I think is ridiculously vague. And we’re still seeing (or not seeing) the effect of the government shutdown. Today’s Export Sales report was only as of November 13th, so we’re seeing data that’s a month behind and not seeing what’s actually happening now. There have been very strong “flash sales” announced over the past 10 days or so, with most of the bigger numbers being attributed to China or “unknown” which does indicate to me that they are buying Beans, we just don’t know exactly how much. I think as we move forward, demand will increase, putting a stronger upward bias to the prices.
Aggressive and well-margined traders may do well to consider long futures positions at this time. Perhaps an entry at 1100 with a 10 cent stop might work well. That’s only a $500 risk before your commissions and fees. I might look to exit that trade at 1150 which would be a 50 cent, or $2,500 gain, before your commissions and fees.
Less aggressive traders may do well to consider a Bullish Call Spread in the March contract. The March 1100/1150 spread can be bought for about 15 cents ($750 before your commissions/fees) with a GTC order to exit that spread at 2x what you paid for it.
March Soybeans (Weekly)
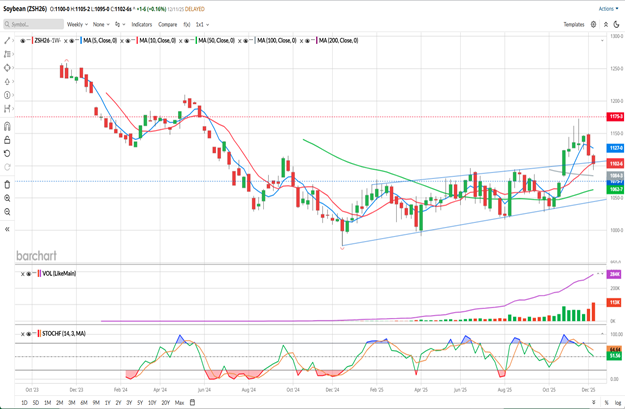
It’s a choppy chart, but the weekly March Soybean chart appears to have made a bullish turn, in my opinion. You might notice the blue trendlines that I’ve drawn on the chart. The lower is from the December 2024 lows connecting to the October 2025 lows and the upper is drawn from the January 2025 highs to the mid-August 2025 highs. The lower tells me that the market is in an uptrend, along with the 50-week moving average (green, 1062 7/8), as both are inclined higher. The upper tells me that prices have broken out of the trading range in late October and have now come back to that trendline as support. The 10-week moving average (red, 1104 1/2) is just above today’s close and not very far away. The 5-week moving average (blue, 1127) is above the market price and has hooked lower over the past couple of weeks. That will offer some resistance, I think, but I don’t think it will be too hard for the market to overcome. The 100-week average hasn’t been around for long (grey, 1084 3/8) but it’s below the market (still declining) and should also offer a level of support, in my opinion. There’s also still a gap (blue dotted line) at 1076 that some folks think needs to be filled, but the red dotted line on the chart at 1174 ¾ highlights an unfilled gap from May 2024. They don’t HAVE to be filled, but in my experience they usually will be. Sometimes it may take weeks, months or years to happen. Stochastics (bottom sub-graph) have come back from overbought to about mid-range. For as bearish (or not bullish) as the sentiment has been this year, Soybeans have spent more time over the past year being overbought than they have oversold to my eye. The market is down 13 ¼ cents this week and down 30 cents last week, but I don’t think the weakness can last.
You can view Barchart’s seasonal data here According to my reading of their table, the March Beans typically stay firm and rally from October to April. It’s never a straight or smooth trend and prices don’t always rise.
If you like what you’ve read here and would like to see more like this from Walsh Trading, please Click here and sign up for our daily futures market email.
Jefferson Fosse Walsh Trading
Direct 312 957 8248 Toll Free 800 556 9411
jfosse@walshtrading.com www.walshtrading.com
Walsh Trading, Inc. is registered as a Guaranteed Introducing Broker with the Commodity Futures Trading Commission and an NFA Member.
Futures and options trading involves substantial risk and is not suitable for all investors. Therefore, individuals should carefully consider their financial condition in deciding whether to trade. Option traders should be aware that the exercise of a long option will result in a futures position. The valuation of futures and options may fluctuate, and as a result, clients may lose more than their original investment. The information contained on this site is the opinion of the writer or was obtained from sources cited within the commentary. The impact on market prices due to seasonal or market cycles and current news events may already be reflected in market prices. PAST PERFORMANCE IS NOT NECESSARILY INDICATIVE OF FUTURE RESULTS. All information, communications, publications, and reports, including this specific material, used and distributed by Walsh Trading, Inc. (“WTI”) shall be construed as a solicitation for entering into a derivatives transaction. WTI does not distribute research reports, employ research analysts, or maintain a research department as defined in CFTC Regulation 1.71.

/EV%20in%20showroom%20by%20Robert%20Way%20via%20Shutterstock.jpg)


/Oracle%20Corp_%20office%20logo-by%20Mesut%20Dogan%20via%20iStock.jpg)
/JPMorgan%20Chase%20%26%20Co_%20sign-by%20Robson90%20via%20Shutterstock.jpg)