In a late August Barchart article on Bitcoin, I concluded with the following:
Bitcoin and cryptocurrencies are highly volatile assets. While the bullish trend remains firmly intact, the price history suggests that another price plunge is not out of the question.
Bitcoin was trading just below $116,200 per token on August 22, and while the price rose to a new record high in October, it was below the $100,000 level in December 2025.
Bitcoin’s rally ran out of upside steam at the early October 2025 record high
Bitcoin rose to a new record high of $126,184.05 on October 6, 2025, only to run out of upside steam.
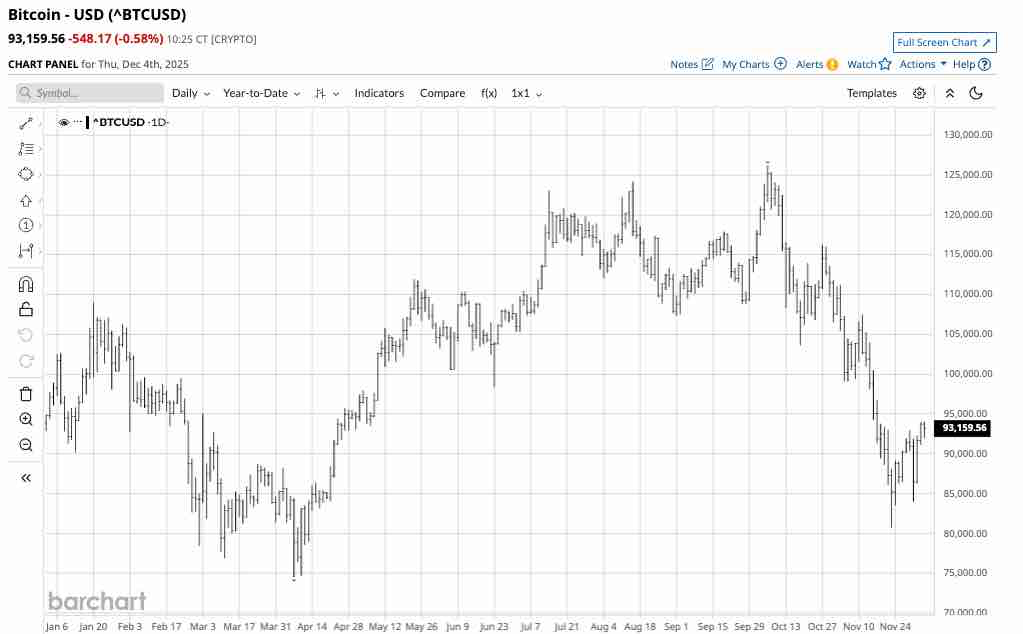
The year-to-date chart highlights the pattern of lower highs and lower lows that has taken Bitcoin to a low of $80,742.05 on November 21. At just above the $93,000 level on December 1, Bitcoin remains in a bearish trend, but has recovered from the most recent low.
Substantial corrections are nothing new
Bitcoin’s latest decline took it 36% lower from the October peak to the November low. Meanwhile, the loss of over one-third of its value is nothing new for the volatile asset that climbed from five cents in 2010.
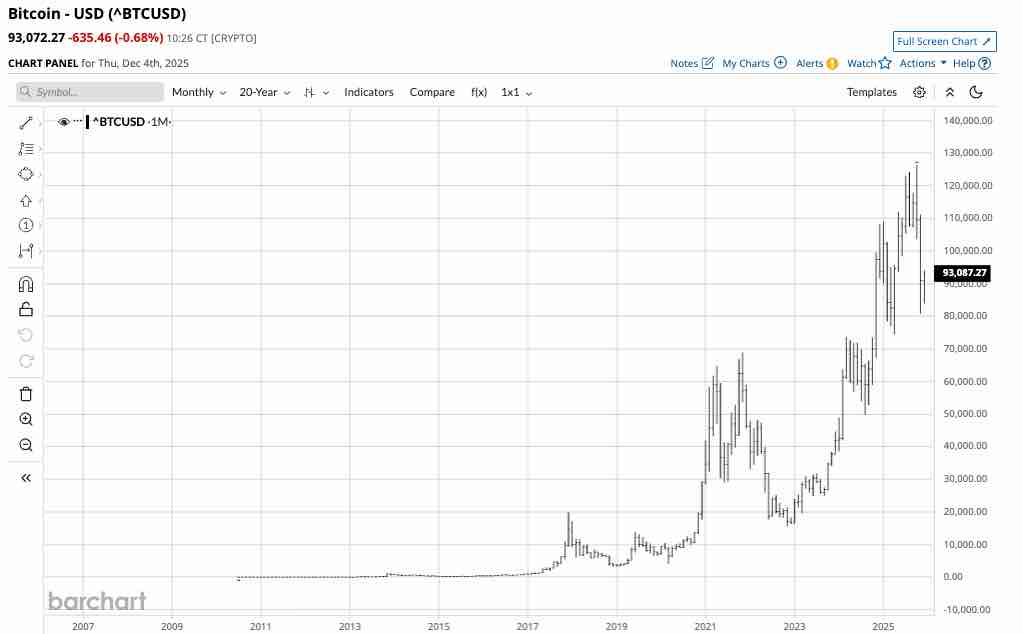
The monthly chart dating back to 2010 illustrated a series of substantial downside corrections on a percentage basis:
- Bitcoin fell 84.1% from the December 2017 high of $19,862 to the December 2018 low of $3,158.10 per token.
- Bitcoin fell 55.3% from the April 2021 high of $64,789.27 to the June 2021 low of $28,957.79 per token.
- Bitcoin fell 77.5% from the November 2021 high of $68,906.48 to the November 2022 low of $15,516.53 per token.
- Bitcoin fell 32.4% from the March 2024 high of $73,662.76 to the August 2024 low of $49,784.02 per token.
- Bitcoin fell 31.7% from the January 2025 high of $109,012.48 to the April 2025 low of $74,496.62 per token.
The most recent 36% decline is similar to the corrections in early 2025 and 2024. However, a deeper correction is possible, as seen in 2017, 2021, and 2022.
Levels to watch in Bitcoin
The three-year weekly chart highlights the bullish pattern of higher lows and higher highs since early 2023.
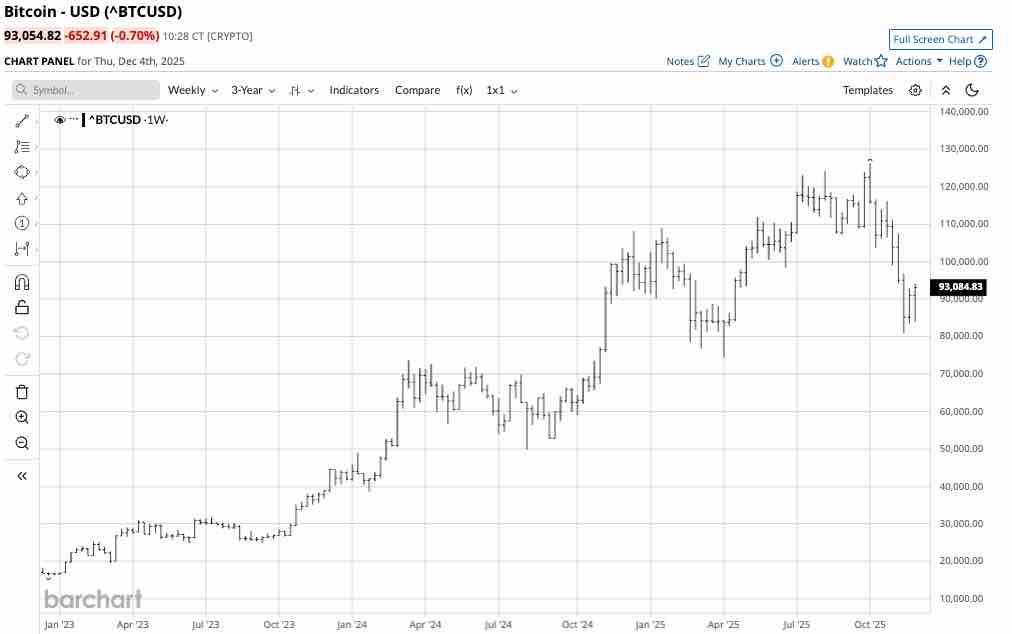
While technical resistance is at the October 2025 record high, the first downside target is at the April 2025 low of $74,496.62 per token. A decline below that level would negate the bullish trend and could set the stage for a challenge of the next support level at the August 2024 low of $49,784.02.
Buying on price weakness has been optimal- Bitcoin remains a highly risky asset
While Bitcoin entered a bearish trend in late 2025, the debate over its future remains passionate. Supporters believe the asset could find a bottom and recover, reaching new highs over the coming years. When Bitcoin was much lower in 2022, forecasts of it rising to over $100,000 seemed outlandish. Today, some supporters believe it will eventually rise to over $1 million, which, while equally outlandish, cannot be discounted given the price action over the past years. The detractors continue to believe Bitcoin and other cryptocurrencies are “pet rocks” with little or no intrinsic value.
If the pattern over the past fifteen years holds, buying Bitcoin during corrections, leaving plenty of room to accumulate on price weakness and deep corrections, will be optimal.
The ETFs that move higher and lower with the leading cryptocurrency
While the most direct route for a long position in Bitcoin is purchasing the cryptocurrency through platforms such as Coinbase (COIN), the following ETF products hold Bitcoin, providing indirect price exposure without holding it in computer wallets or on crypto exchanges
- IBIT: At $52.78 per share, IBIT had over $74.85 billion in assets under management. IBIT trades an average of over 73 million shares daily and charges a 0.25% management fee.
- FBTC: At $81 per share, FBTC had over $19.25 billion in assets under management. FBTC trades an average of over 7.32 million shares daily and charges a 0.25% management fee.
- GBTC: At $72.66 per share, GBTC had over $17.50 billion in assets under management. GBTC trades an average of over 6.1 million shares daily and charges a 1.50% management fee.
- BTC: At $41.12 per share, BTC had nearly $2.80 billion in assets under management. BTC trades an average of over 2.56 million shares daily and charges a 0.15% management fee.
- ARKB: At $30.86 per share, ARKB had over $4.19 billion in assets under management. ARKB trades an average of over 6.24 million shares daily and charges a 0.21% management fee.
- HODL: At $26.27 per share, HODL had over $1.31 billion in assets under management. HODL trades an average of over 2.21 million shares daily and charges a 0.25% management fee.
While other ETFs move in tandem with Bitcoin’s price, the Bitcoin ETFs listed above have assets of over $1 billion and daily trading volumes of over 2.7 million shares, making them the most liquid choices.
Time will tell if the bullish trend in Bitcoin is over, or if the current or an even deeper decline will lead to higher highs. Bitcoin is a highly volatile asset with an increasing addressable market. However, the top crypto is not for the faint of heart. Only invest capital you can afford to lose, as the quest for massive gains comes with commensurate risks.
On the date of publication, Andrew Hecht did not have (either directly or indirectly) positions in any of the securities mentioned in this article. All information and data in this article is solely for informational purposes. For more information please view the Barchart Disclosure Policy here.
/A%20close-up%20of%20a%20SpaceX%20sign%20by%20Sundry%20Photography%20via%20Adobe%20Stock.jpeg)


/AI%20(artificial%20intelligence)/AI%20chip%20by%203Dsss%20via%20Shutterstock.jpg)
