
Take advantage of our Cyber Monday deal, and get exclusive access to our members area at wavetraders.com this is the single biggest discount we do per year! We do daily updates on Stocks, Indices, Commodities, Forex and Crypto too!
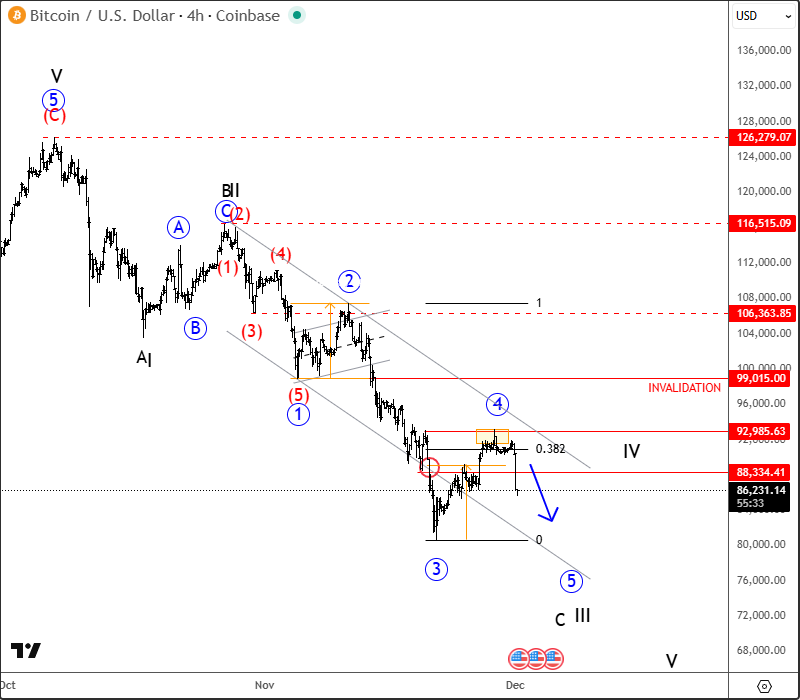
Bitcoin dropped below 90k level, which more and more looks like a top formation on a daily chart, and looks like it's unfolding an impulse into wave (A) from the highs. In the 4-hour chart, it's extending impulsively lower, which looks like wave 3 of an ongoing five-wave bearish cycle within higher degree wave C or III, so more weakness can be seen while the price is below 99k area. After the recent corrective pullback in wave 4 into the projected resistance area, it seems like it's now on the way lower within wave 5 of C/III towards 80k-74k area. Any early rally back above channel resistance line and 99k area would be a signal that temporary support is in place
Bic Picture:
Bitcoin may have completed a higher degree wave (V) of III within an ending diagonal / wedge pattern. Even cyclically, it found the top in October 2025, so be aware of a bear market now and higher degree wave IV correction
Thank you for reading! Until next time

/A%20Lucid%20Motors%20vehicle%20parked%20in%20front%20of%20a%20showroom_%20Image%20by%20Michael%20Berlfein%20via%20Shutterstock_.jpg)
/Broadcom%20Inc%20logo%20on%20phone%20and%20site-by%20Majahid%20Mottakin%20via%20Shutterstock.jpg)

/Tesla%20Inc%20logo%20by-%20baileystock%20via%20iStock.jpg)