




Data center products and services company Vertiv (NYSE:VRT) fell short of the market’s revenue expectations in Q2 CY2026, but sales rose 24.1% year on year to $3.27 billion. On the other hand, next quarter’s outlook exceeded expectations with revenue guided to $3.75 billion at the midpoint, or 0.9% above analysts’ estimates. Its non-GAAP profit of $1.52 per share was 6.4% above analysts’ consensus estimates.
Is now the time to buy Vertiv? Find out by accessing our full research report, it’s free.
Vertiv (VRT) Q2 CY2026 Highlights:
- Revenue: $3.27 billion vs analyst estimates of $3.39 billion (24.1% year-on-year growth, 3.4% miss)
- Adjusted EPS: $1.52 vs analyst estimates of $1.43 (6.4% beat)
- The company lifted its revenue guidance for the full year to $14 billion at the midpoint from $13.75 billion, a 1.8% increase
- Management raised its full-year Adjusted EPS guidance to $6.70 at the midpoint, a 5.5% increase
- Operating Margin: 19.5%, up from 16.8% in the same quarter last year
- Free Cash Flow Margin: 28.3%, up from 10.5% in the same quarter last year
- Organic Revenue rose 17.8% year on year (miss)
- Market Capitalization: $103.5 billion
"This quarter reflects the compounding effect of years of deliberate investment in technology, capacity, and customer partnerships," said Giordano Albertazzi, Vertiv's Chief Executive Officer.
Company Overview
Formerly part of Emerson Electric, Vertiv (NYSE:VRT) manufactures and services infrastructure technology products for data centers and communication networks.
Revenue Growth
Examining a company’s long-term performance can provide clues about its quality. Any business can have short-term success, but a top-tier one grows for years. Thankfully, Vertiv’s 18.9% annualized revenue growth over the last five years was incredible. Its growth surpassed the average industrials company and shows its offerings resonate with customers, a great starting point for our analysis.
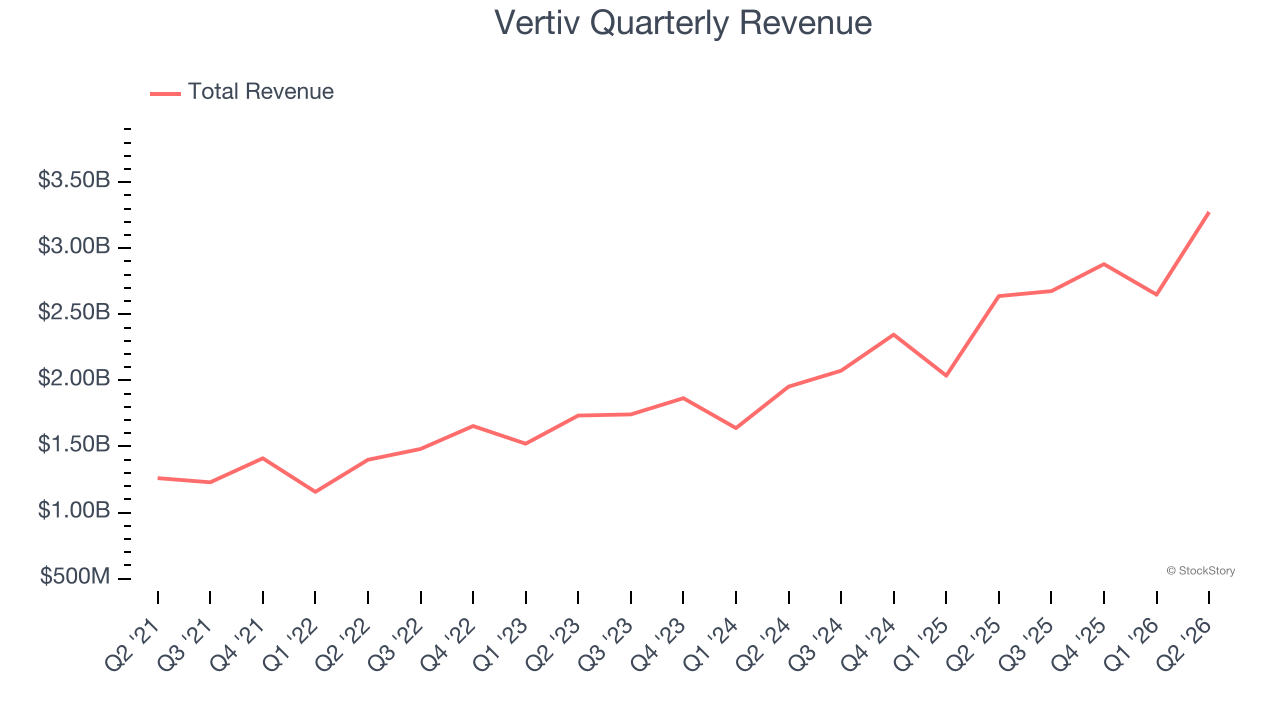
Long-term growth is the most important, but within industrials, a half-decade historical view may miss new industry trends or demand cycles. Vertiv’s annualized revenue growth of 26.3% over the last two years is above its five-year trend, suggesting its demand was strong and recently accelerated. 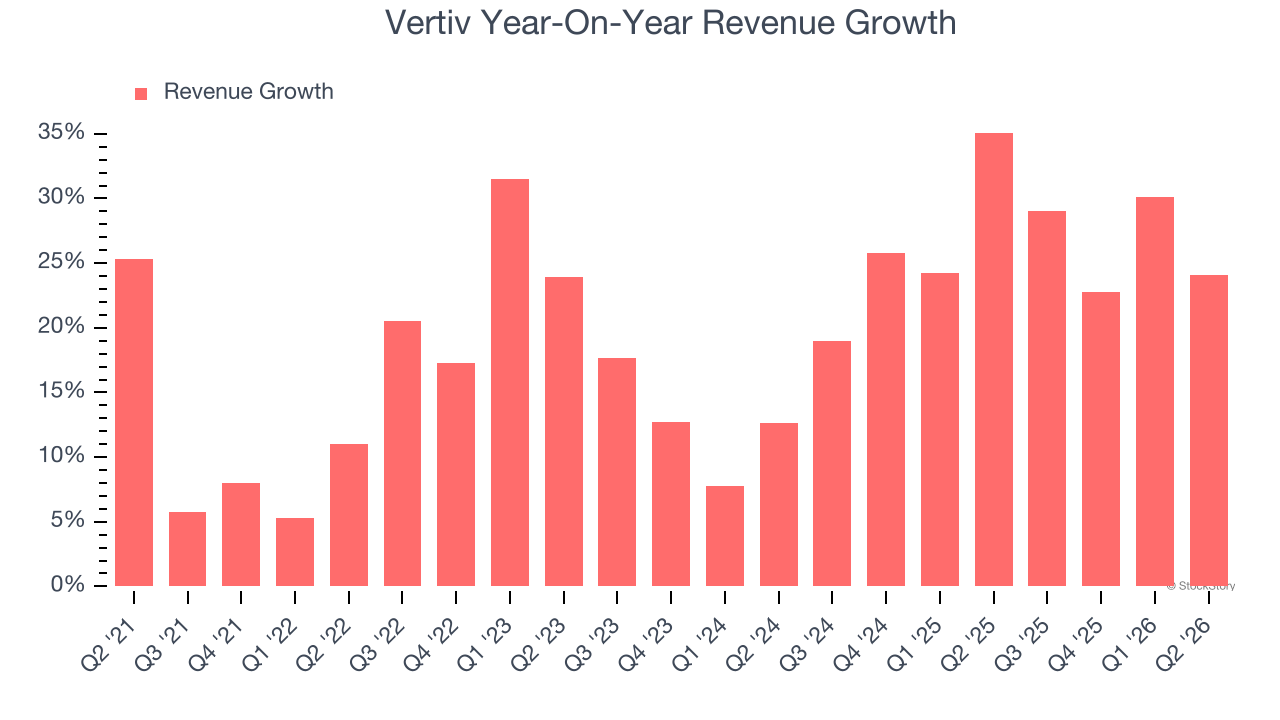
Vertiv also reports organic revenue, which strips out one-time events like acquisitions and currency fluctuations that don’t accurately reflect its fundamentals. Over the last two years, Vertiv’s organic revenue averaged 24.2% year-on-year growth. Because this number is lower than its two-year revenue growth, we can see that some mixture of acquisitions and foreign exchange rates boosted its headline results. 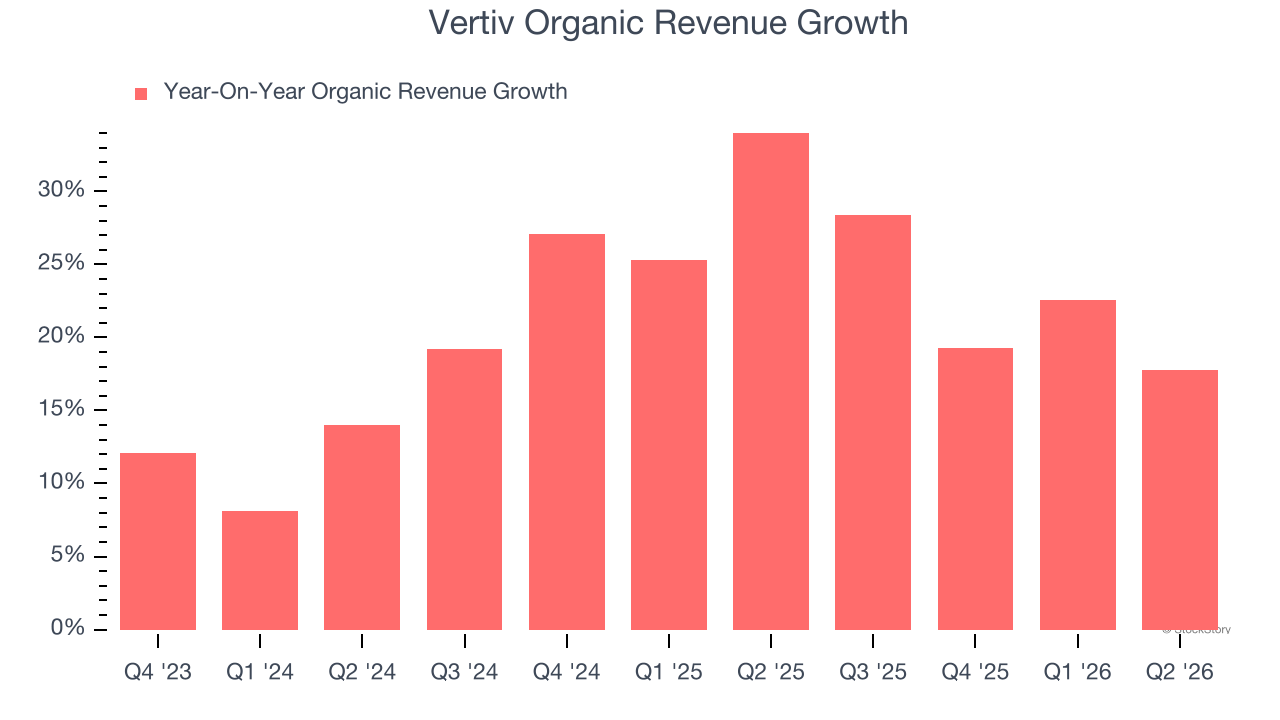
This quarter, Vertiv generated an excellent 24.1% year-on-year revenue growth rate, but its $3.27 billion of revenue fell short of Wall Street’s high expectations. Company management is currently guiding for a 40.1% year-on-year increase in sales next quarter.
Looking further ahead, sell-side analysts expect revenue to grow 37.2% over the next 12 months, an improvement versus the last two years. This projection is eye-popping for a company of its scale and suggests its newer products and services will catalyze better top-line performance.
ONE MORE THING: The $21 AI Application Stock Wall Street Forgot. While Wall Street obsesses over who’s building AI, one company is already using it to print money. And nobody’s paying attention.
AI chip stocks trade at ridiculous valuations. This company processes a trillion consumer signals monthly using AI and trades at a third of the price. The gap won’t last. The institutions will figure it out. You need to see this first. Read the FREE Report Before They Notice.
Operating Margin
Operating margin is an important measure of profitability as it shows the portion of revenue left after accounting for all core expenses — everything from the cost of goods sold to advertising and wages. It’s also useful for comparing profitability across companies with different levels of debt and tax rates because it excludes interest and taxes.
Vertiv has been an efficient company over the last five years. It was one of the more profitable businesses in the industrials sector, boasting an average operating margin of 13.8%. This result isn’t too surprising as its gross margin gives it a favorable starting point.
Looking at the trend in its profitability, Vertiv’s operating margin rose by 17.8 percentage points over the last five years, as its sales growth gave it immense operating leverage.
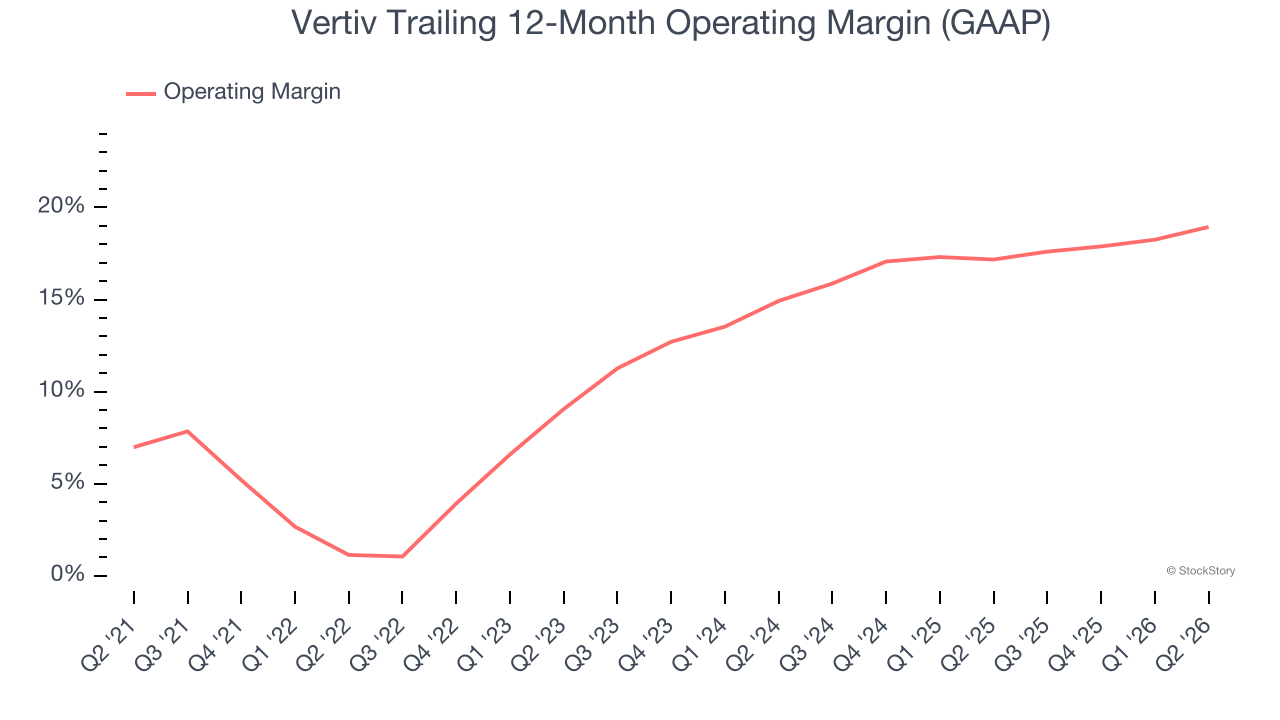
In Q2, Vertiv generated an operating margin profit margin of 19.5%, up 2.7 percentage points year on year. Since its gross margin expanded more than its operating margin, we can infer that leverage on its cost of sales was the primary driver behind the recently higher efficiency.
Earnings Per Share
We track the long-term change in earnings per share (EPS) for the same reason as long-term revenue growth. Compared to revenue, however, EPS highlights whether a company’s growth is profitable.
Vertiv’s EPS grew at 35.2% compounded annual growth rate over the last five years, higher than its 18.9% annualized revenue growth. This tells us the company became more profitable on a per-share basis as it expanded.
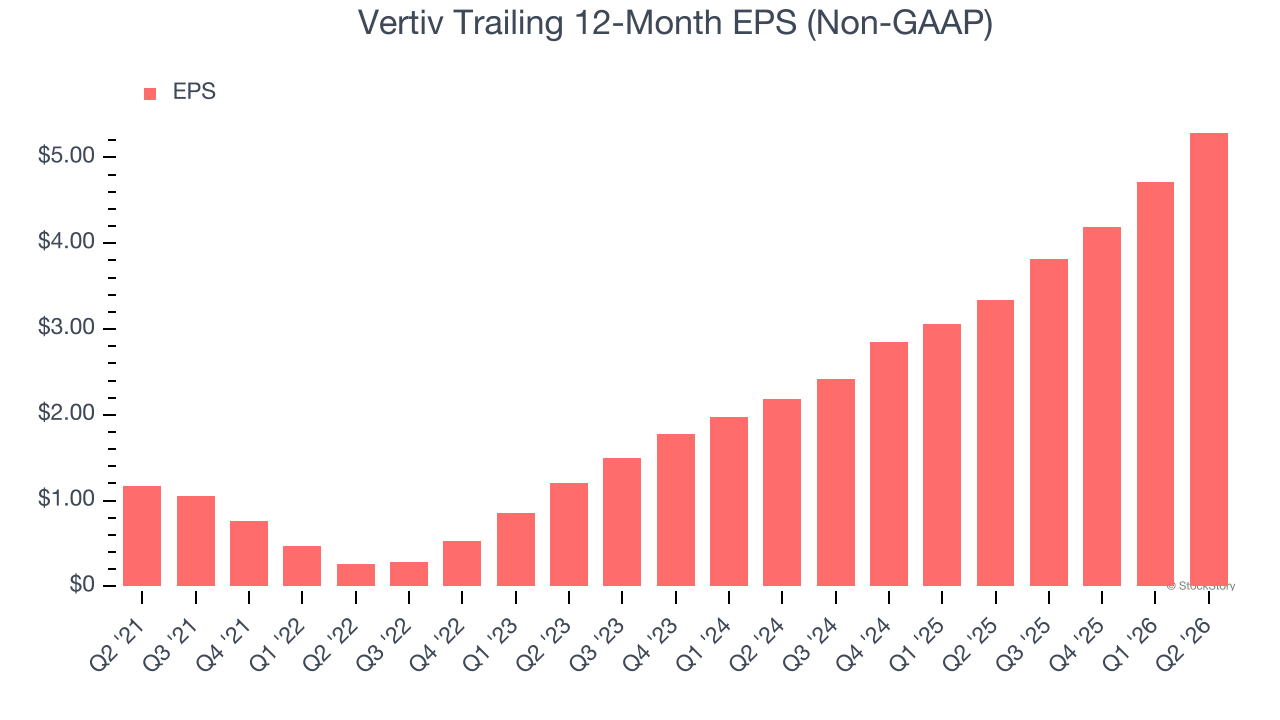
We can take a deeper look into Vertiv’s earnings quality to better understand the drivers of its performance. As we mentioned earlier, Vertiv’s operating margin expanded by 17.8 percentage points over the last five years. This was the most relevant factor (aside from the revenue impact) behind its higher earnings; interest expenses and taxes can also affect EPS but don’t tell us as much about a company’s fundamentals.
Like with revenue, we analyze EPS over a more recent period because it can provide insight into an emerging theme or development for the business.
For Vertiv, its two-year annual EPS growth of 55.8% was higher than its five-year trend. We love it when earnings growth accelerates, especially when it accelerates off an already high base.
In Q2, Vertiv reported adjusted EPS of $1.52, up from $0.95 in the same quarter last year. This print beat analysts’ estimates by 6.4%. Over the next 12 months, Wall Street expects Vertiv’s full-year EPS to grow 40% from $5.29 to $7.41.
Key Takeaways from Vertiv’s Q2 Results
We were impressed by Vertiv’s optimistic full-year EPS guidance, which blew past analysts’ expectations. We were also glad its full-year revenue guidance slightly exceeded Wall Street’s estimates. On the other hand, its revenue missed and its organic revenue fell short of Wall Street’s estimates. Overall, this was a weaker quarter. The stock traded down 10.4% to $242.91 immediately after reporting.
Should you buy the stock or not? When making that decision, it’s important to consider its valuation, business qualities, as well as what has happened in the latest quarter. We cover that in our actionable full research report which you can read here (it’s free).


/Microsoft%20headquarters%20By%20Peter.jpeg)
/A%20close-up%20of%20the%20Broadcom%20logo%20on%20a%20smartphone%20by%20Timon%20via%20Adobe%20Stock.jpeg)
/Chipset%20held%20over%20rush%20hour%20traffic%20by%20Jae%20Young%20Ju%20via%20iStock.jpg)
/Amazon%20-%20Image%20by%20bluestork%20via%20Shutterstock.jpg)