Chart of the Day
The information and opinions expressed below are based on my analysis of price behavior and chart activity
Tuesday, September 30, 2025
If you like this article and would like to receive more information on the commodity markets from Walsh Trading, please use the link to join our email list -Click here
Every morning, at about 8 AM CST, I post a short video highlighting where I see opportunities in the futures markets. You can view my most recent video here
December Corn (Daily)
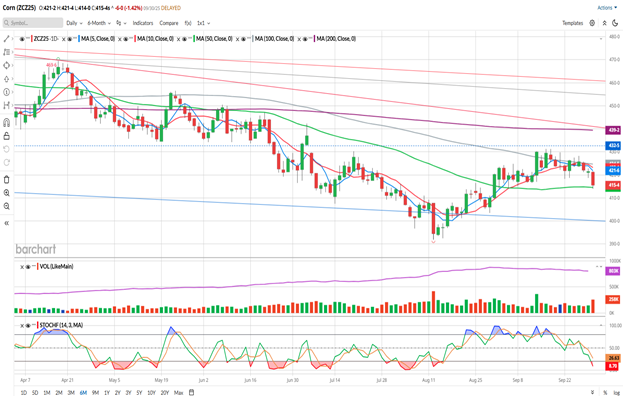
Today, December Corn closed at 4.15 ½, down 6 cents on the day. This was the lowest close for Corn since August 28th, a month ago. And since today’s the last day of the month, for the month of September, Dec Corn finished down 4 ¾ cents. While the overnight market was lower at the pause on Tuesday morning, the market pushed lower following the USDA’s Quarterly Grain Stock data release at 11 AM. That showed the Corn stocks at 1.53 billion bushels nationwide, a drop of 13% from last year’s number at 1.763 billion. I think the bearish reaction stemmed from the actual number being higher than the average pre-report estimates, which were near 1.3 billion bushels. In other words, we have more on hand than the market expected, getting a bearish reaction. Harvest continues, with progress at 18% complete, slightly below the 5-year average pace, but not by a concerning amount, in my opinion. Yield indications that I’ve gotten from the folks I speak with tell me that the crop is good, but not “as good” as was thought a month or so ago. It seems that Southern Rust, along with other late-season fungi, has taken the top off of the yields. I think it’s still going to be a good harvest and will still post a record amount of bushels, but will end up below the 16.8 billion pegged by the USDA last month.
The 5- and 10-day moving averages (blue/red, 4.21 ¾ and 4.23 1/8, respectively) made a bearish crossover last Wednesday and are now offering potential resistance levels. The 50-day average (green) at 4.14 ½ held as support today, which is a positive sign for the bulls. The 100-day average (grey) which the market held along for about 2 weeks is now at 4.24 5/8, also a potential resistance level. It does not appear that the gap at 4.32 ¾ (blue dotted horizontal) will be filled anytime soon. The prices got within 1 ½ cents on Sept 16th and 17th, but faded lower before filling. I still think that gap is in play and has a good chance of getting filled. The market is also at/near the 38% Fibonacci retracement (Aug low-Sept high) of 4.16 ¼ which could also be a support/resistance level. The 50% mark is near 4.11 ¾, for your information, but the Fibonacci retracement is not shown/drawn on the chart above.
Can Corn prices go lower? Absolutely. We’re in the process of harvesting a record crop. If yields improve (or don’t worsen) through the duration, $4.00 or lower is certainly within expectations. That $4.00 mark is a nice big, fat, round even number and may offer support, should we get there. If that can’t hold, the August 12th low of 3.92 might be in play. Also, recall that last year (2024) this market made it’s high at 4.59 ¾ on Oct 2nd, before dropping 26 ½ cents to the low of October 17th. So yes, the market can go lower. And recent trade activity may be the beginning of a new downward push. The last time the market interacted with the 100-day moving average was over 5 days this past April. And at that time, we saw Corn go from 4.69 ½ all the way down to 3.92 on August 12th.
Can Corn prices go higher? Absolutely. We’ve known that this crop is going to be large for quite some time. It’s not like it snuck up on anyone who’s been paying any attention. Do I think that Corn prices are going to $5.00? Not presently, no, I don’t think that’s in the cards. We’d need a dramatic shift in demand, or some other outlier, to get us there. There’s still an overhead gap (4.32 ¾, from July 3rd) that needs to be filled. And I do think that the 200-day average (purple, 4.39 ¼) still offers solid long-term resistance and a reasonable upside target. If the nearby support at the 50-day average can hold and prices start to recover this week, the bulls may get re-invigorated in short order.
Producers that are still un-hedged or have un-sold bushels may do well to consider December 4.00 Put Options. With 52 days until expiration, those options offer good value for protection against potential downside risk. Today those settled at 3 ¾ cents or $187.50 before your commissions/fees. If you do choose those, be sure to mind the option Delta, as you’ll need more that 1 to adequately protect a 5,000 bushel contract.
Speculators may do well to stay on the short side of the market, perhaps risking a close above the 100-day average. Overall, the long-term trend is still down.
If you like what you’ve read here and would like to see more like this from Walsh Trading, please Click here and sign up for our daily futures market email.
Every morning, at about 8 AM CST, I post a short video highlighting where I see opportunities in the futures markets. You can view my most recent video here
December Corn (Weekly)
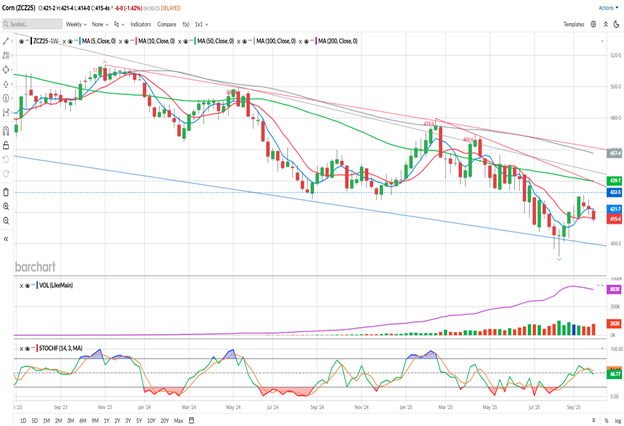
Following Tuesday’s close, Dec Corn is down 6 ½ cents this week. The first thing you might notice from the weekly December Corn chart above is that this market has been in a downtrend for the entire view of this chart. This view goes back to July of 2023, over two years and there doesn’t seem like there’s much to be bullish about. The most recent rally lasted for 4 weeks, with only 3 of those being “up” weeks and the market has turned down for the past 3 weeks, including this one. The 5- and 10-week moving averages are currently in a bullish configuration (5 above the 10) but today’s close at 4.14 is below both of those. Unless the market can rally higher over the next few days, that’s not a bullish sign, in my opinion. The 5-week (blue) is at 4.21 7/8 and the 10-week (red) is at 4.15 ½. Neither is too far away and certainly within range, should the bulls re-establish themselves. Both of those averages may become resistance levels from here. As is the 50-week (green) at 4.39 7/8 and the 100-week (grey) at 4.57 ¾. In fact the 100-week is very near the top of a trading channel or range, highlighted by the upper red horizontal line. Stochastics (bottom sub-graph) are just above mid-range and pointing lower. You might notice that this market has been more comfortable being “oversold” than “overbought” for the past 2+ years. $4.00 may offer big, fat, round number support from here, but if that can’t hold a visit of that spike low of 3.92 (or lower) may be in the future.
For those that are interested, you can find Barchart’s Seasonal Data for Dec Corn here. 10 of the last 15 years have seen December Corn prices rally during the month of October.
If you like what you’ve read here and would like to see more like this from Walsh Trading, please Click here and sign up for our daily futures market email.
Every morning, at about 8 AM CST, I post a short video highlighting where I see opportunities in the futures markets. You can view my most recent video here
Jefferson Fosse Walsh Trading
Direct 312 957 8248 Toll Free 800 556 9411
jfosse@walshtrading.com www.walshtrading.com
Walsh Trading, Inc. is registered as a Guaranteed Introducing Broker with the Commodity Futures Trading Commission and an NFA Member.
Futures and options trading involves substantial risk and is not suitable for all investors. Therefore, individuals should carefully consider their financial condition in deciding whether to trade. Option traders should be aware that the exercise of a long option will result in a futures position. The valuation of futures and options may fluctuate, and as a result, clients may lose more than their original investment. The information contained on this site is the opinion of the writer or was obtained from sources cited within the commentary. The impact on market prices due to seasonal or market cycles and current news events may already be reflected in market prices. PAST PERFORMANCE IS NOT NECESSARILY INDICATIVE OF FUTURE RESULTS. All information, communications, publications, and reports, including this specific material, used and distributed by Walsh Trading, Inc. (“WTI”) shall be construed as a solicitation for entering into a derivatives transaction. WTI does not distribute research reports, employ research analysts, or maintain a research department as defined in CFTC Regulation 1.71.

/Space/Rocket%20launching%20into%20space%20by%20BEST%20BACKGROUNDS%20via%20Shutterstock.jpg)
/A%20Palantir%20office%20building%20in%20Tokyo_%20Image%20by%20Hiroshi-Mori-Stock%20via%20Shutterstock_.jpg)
/Close-up%20shot%20of%20Rivian%20R1T_%20Image%20by%20Trong%20Nguyen%20via%20%20Shutterstock_.jpg)
