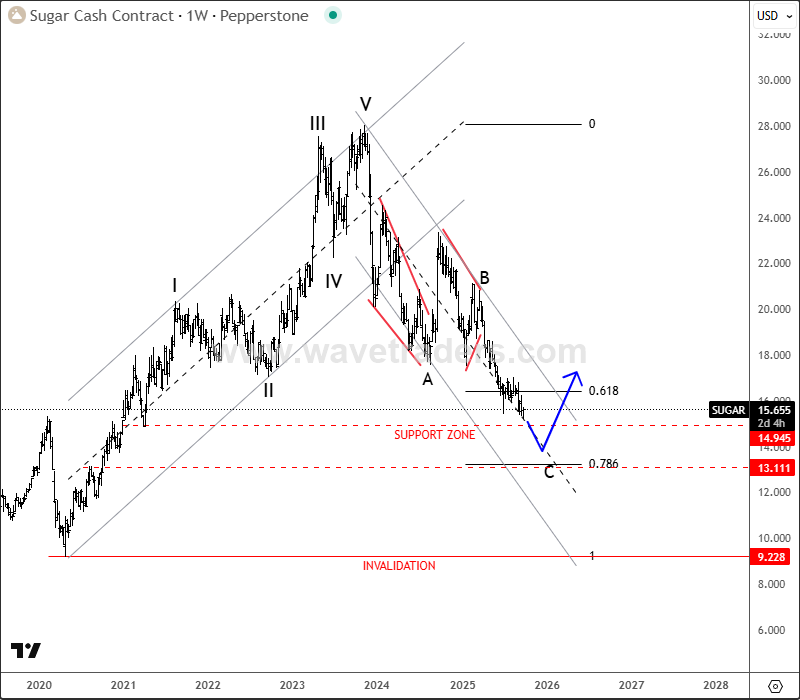
Sugar has been trading lower since 2023 when we spotted final wave V of an impulse on the weekly chart. So from Elliott wave perspective, it’s trading in a multi-year higher degree ABC corrective decline.
From Elliott wave perspective, it’s coming nicely lower within wave C of a higher degree ABC correction on the weekly basis, which can stop around 61,8%-78,6% Fibonnaci retracement and 14-13 support area, so soon be aware of a bullish reversal, ideally in 2026.
www.wavetraders.com
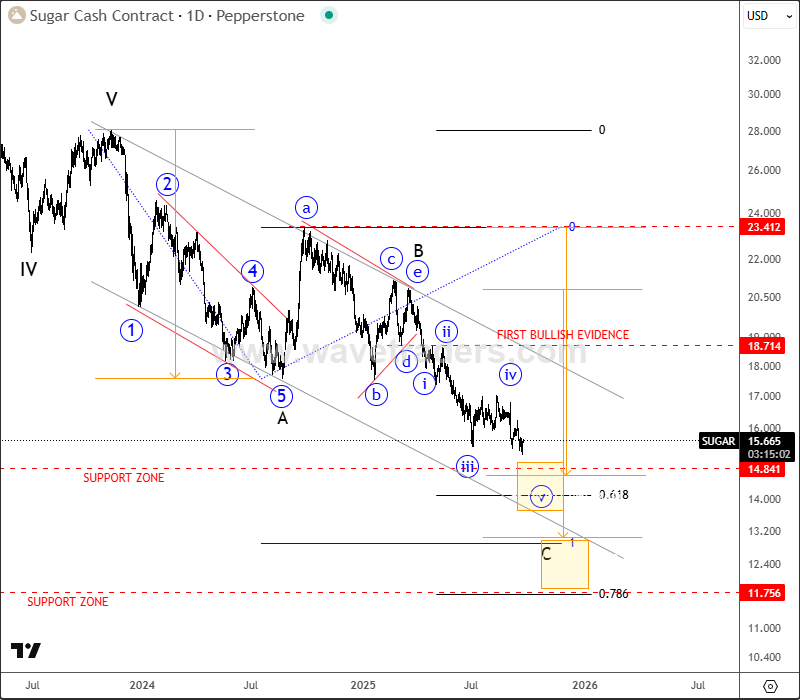
On a daily chart, we can see it nicely falling within a projected five-wave bearish impulse into wave C, and it can be now in the final subwave “v” of C. Once we get a sharp or impulsive rebound back above channel resistance line and 18 area, that’s when support can be place, correction completed, and bulls back in the game.
www.wavetraders.com
If you are interested in more analysis like this, you can watch below our latest recording of a live webinar streamed on September 22, where we covered a lot of other assets:

/Broadcom%20Inc%20HQ%20photo-by%20Sundry%20Photogrpahy%20via%20iStock.jpg)

/Intel%20Corp_%20Santa%20Clara%20campus-by%20jejim%20via%20Shutterstock.jpg)

/Super%20Micro%20Computer%20Inc%20logo%20on%20building-by%20Poetra_RH%20via%20Shutterstock.jpg)