




Dual Edge Research publishes two powerful newsletters that work great individually — and even better together. The Bull Strangle Newsletter focuses on stocks and options, combining stock ownership with premium-selling strategies to generate consistent income and market-beating returns. The Smart Spreads Newsletter specializes in seasonal commodity futures spreads, offering a diversified approach with low correlation to equities. Together, they deliver a complete investment perspective — one focused on income, the other on diversification — all under one simple subscription.
Introduction
Throughout this series, we've explored the factors that have historically contributed to stronger Bull Strangle performance. Institutional ownership, Average True Range, implied volatility, market capitalization, stock price, and volatility levels have all helped improve the probability of selecting stocks that produce more consistent returns. The final metric in the Bull Strangle stock ranking system brings those ideas together from a technical perspective:
- Trend Structure.
While every investor recognizes an uptrend when they see one, defining a strong trend objectively is much more difficult. The goal wasn't to identify stocks with the biggest recent gains. Instead, the objective was to determine which types of trends have historically produced the best results for the Bull Strangle strategy.
Measuring Trend Objectively
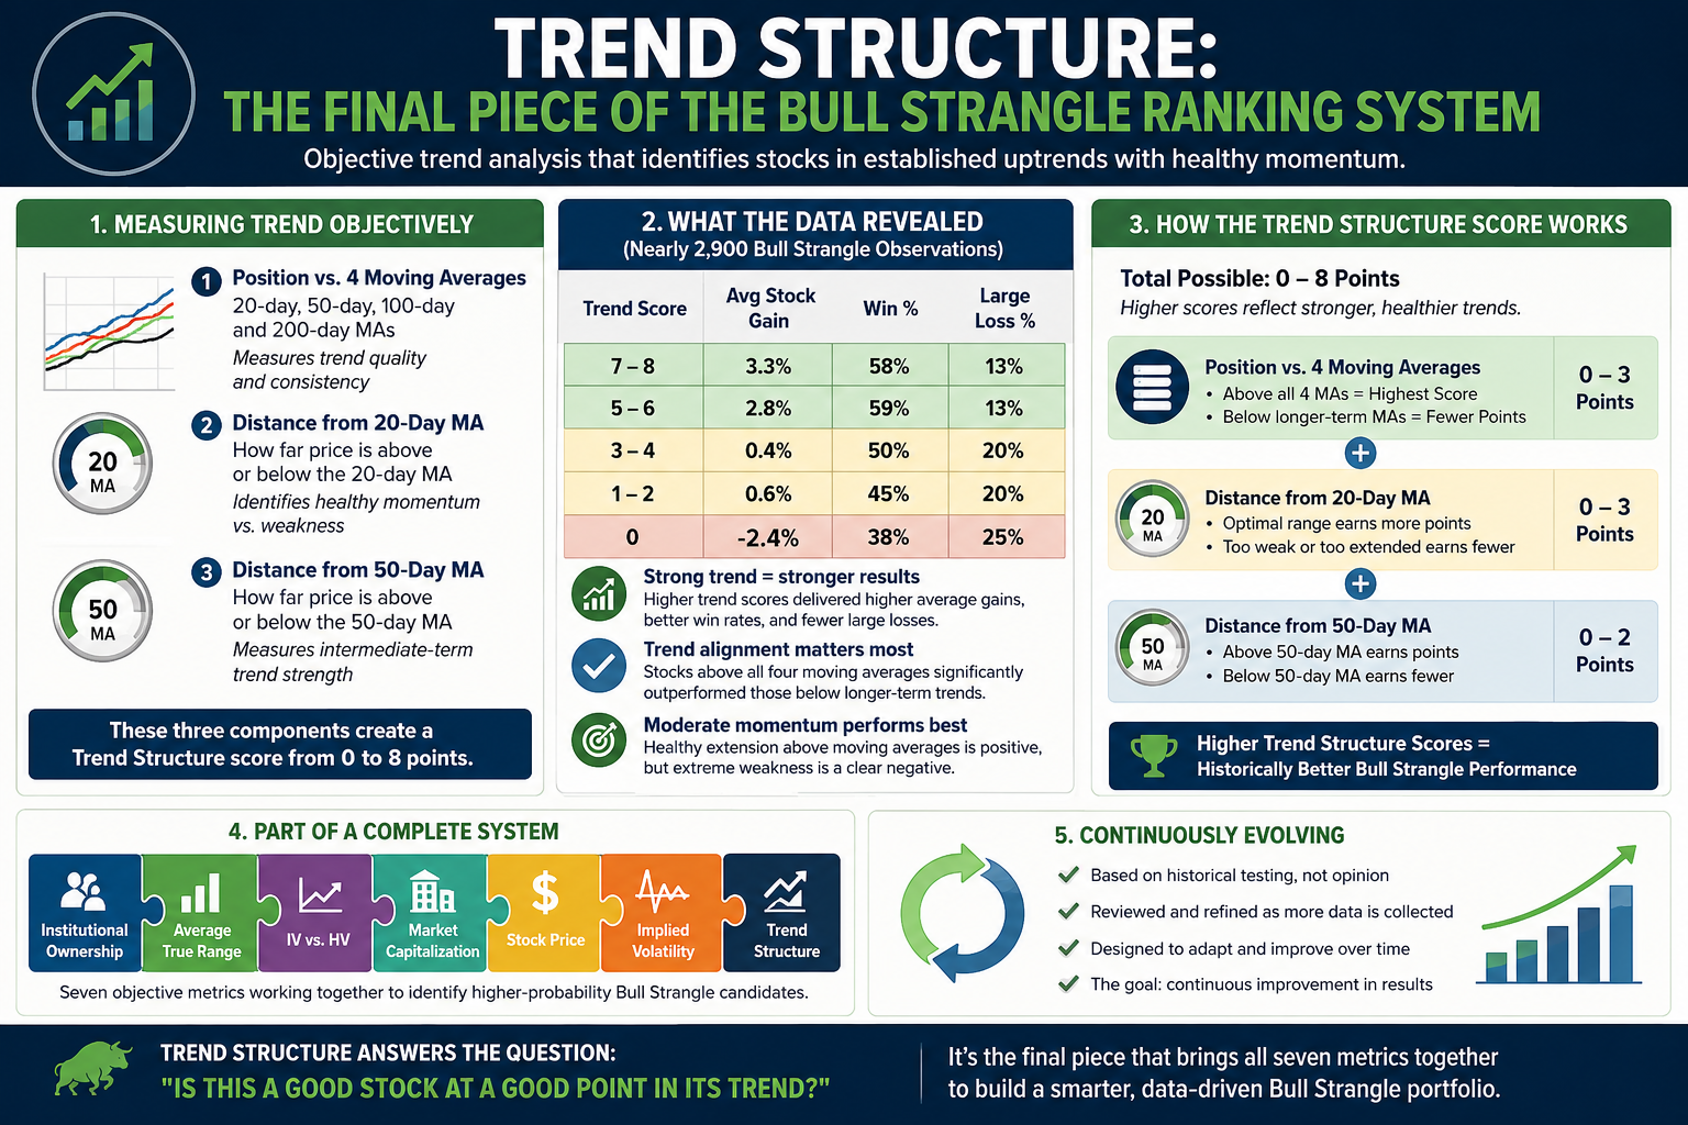
Rather than relying on subjective chart interpretation, the Trend Structure score is built using three measurable characteristics. The first evaluates the stock's position relative to its 20-, 50-, 100-, and 200-day moving averages. Stocks trading above all four moving averages receive the highest score, while those trading below longer-term moving averages receive fewer points. This measures the quality and consistency of the underlying trend.
The second component measures how far the current price has moved above its 20-day moving average. This helps distinguish between stocks experiencing healthy momentum and those that may be weakening or losing direction. The third evaluates the stock's distance from its 50-day moving average, providing an additional measure of intermediate-term trend strength. Together, these three measurements create an objective Trend Structure score ranging from 0 to 8.
What the Historical Data Revealed
Using nearly 2,900 historical Bull Strangle observations, the results showed a clear relationship between trend quality and subsequent stock performance. Stocks receiving the lowest Trend Structure scores produced an average gain of -2.4%, won only 38% of the time, and experienced large losses nearly 25% of the time.
At the opposite end of the scale, the highest-rated trend structures produced average gains exceeding 3%, with win rates approaching 60%. Perhaps more importantly, the individual components confirmed that stocks trading above their major moving averages consistently outperformed those trading below longer-term trend levels. While no single moving average determined success, the combination of long-term trend alignment and healthy momentum produced the strongest historical results.
One Metric Does Not Tell the Whole Story
As with every metric in this series, Trend Structure should never be used in isolation. A stock may have an excellent technical trend but still fail other important screens, such as institutional ownership, implied volatility, market capitalization, or stock price. Likewise, a fundamentally attractive stock may receive a lower ranking if its trend has begun to deteriorate. The Bull Strangle stock ranking system is designed to evaluate all of these characteristics together, with each metric contributing to the overall picture.
A System That Continues to Improve
One of the advantages of a rules-based ranking system is that it can continue to evolve as additional data becomes available. The current Trend Structure score represents the best interpretation of what the historical testing has shown so far. As more trades are completed and the database expands, the weighting and scoring thresholds will continue to be evaluated and refined. The objective is not to create a static ranking system but one that improves as research progresses.
Trend Structure concludes the seven-part series on the Bull Strangle stock ranking methodology. Together, these metrics provide an objective framework for identifying stocks that have historically demonstrated the characteristics associated with stronger Bull Strangle performance. While no ranking system can eliminate risk or guarantee future results, using multiple historically validated factors together yields a more disciplined and data-driven stock selection process than relying on any single metric.
Want to build a more complete trading toolkit?
The Bull Strangle Newsletter focuses on stocks and options, combining stock ownership with disciplined option-selling techniques designed to generate consistent income while managing risk.
The Smart Spreads Newsletter focuses on seasonal commodity spreads, a historically proven approach that seeks opportunities across agricultural, energy, metal, and financial futures markets.
Each strategy is designed to stand on its own, but together they provide a diversified approach that can perform across a wide range of market environments. For traders looking to deepen their education, The Bull Strangle Strategy and Trading Commodity Spreads are both available on Amazon.
Visit BullStrangle.com to subscribe for just $1 for the first month.
For a video overview of the Bull Strangle Newsletter
For a video overview of the Smart Spreads Newsletter
Darren Carlat
Dual Edge Research
(214) 636-3133
DualEdgeResearch@gmail.com
Disclaimer
This information is for informational purposes only and should not be considered as investment advice. Past performance is not indicative of future results, and all investments carry inherent risk. Consult with a financial advisor before making any investment decisions.


/Micron%20Technology%20Inc_%20logo%20on%20building-by%20vzphotos%20vis%20iStock.jpg)
/A%20hand%20holding%20a%20phone%20with%20the%20Reddit%20logo_%20Mamun_Sheikh%20via%20Shutterstock_.jpg)

