This is sponsored content. Barchart is not endorsing the websites or products set forth below.
It’s no secret that 90% of retail futures traders lose money consistently, and it's not because they can't read charts.
It's because they let emotions drive their decisions instead of relying on data.
After working with thousands of traders, we’ve seen this pattern:
The ones who consistently profit follow systematic processes before every trade. They don't just "feel" like ES is going higher... they verify it with historical data and live market conditions.
Table of Contents
- Step 1: Check your favorite report stats
- Step 2: Set up your What's in Play dashboard
- Step 3: configure the what's in play screener
- Step 4: Manage streaks and execute with confidence
Step 1: Check your favorite report stats
Before entering any trade, you need to know the historical probability of your setup actually working.
Most traders skip this entirely. They see a "perfect" setup and jump in without understanding how often that pattern has played out historically.
Here's what the data shows on gap fill success rates:
- ES gap up: 62% filled over the last 6 months
- ES gap down: 62% filled over the last 6 months
- YM gap up: 64% filled over the last 6 months
- YM gap down: 65% filled over the last 6 months
So on both ES and YM, the probabilities are saying a gap will fill ~6/10 times. These are strong probabilities you can trade with! Here’s a quick view of what our reports dashboard looks like:
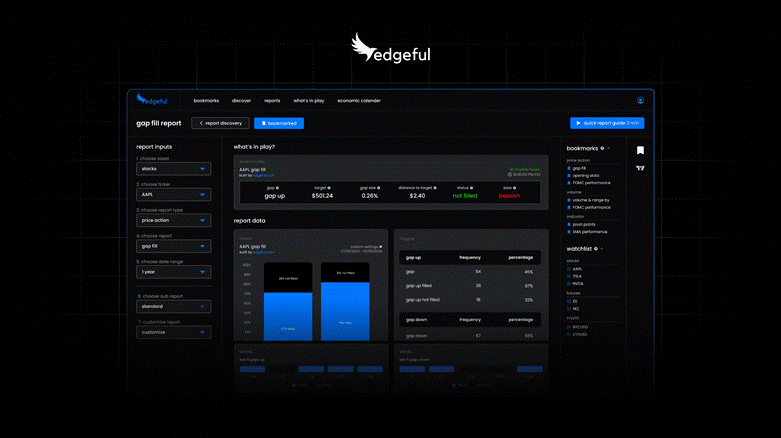
The key is having access to 5+ years of price action data so you can see exactly how your setup has performed, not just assume it works because it "looks good."
You can then use the “date range” selector on the left sidebar to check the stats for your preferred time period.
Step 2: Set up your What's in Play dashboard
Once you know your setup has a high probability historically, you need to see if it's setting up right now with live data.
Most traders waste 30+ minutes every morning manually calculating levels and plotting ranges. here's how to eliminate that process...
The what's in play dashboard shows everything you need in real-time:
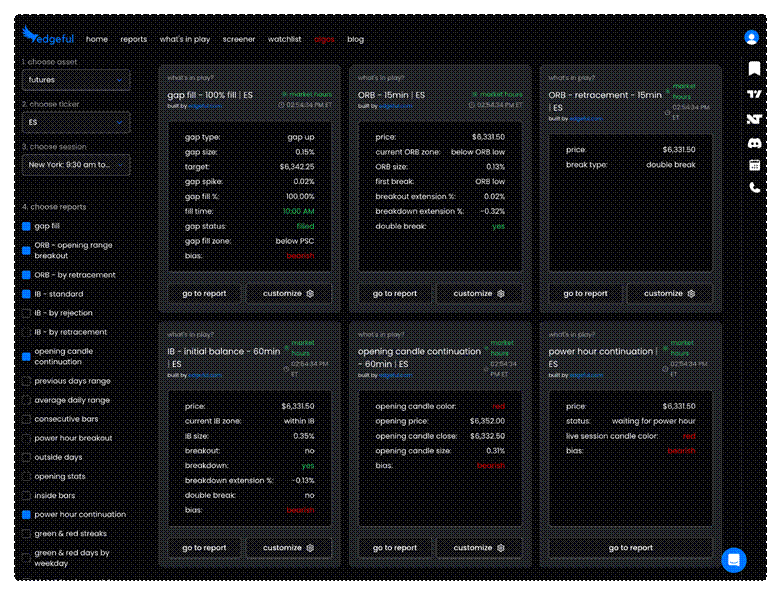
Note: You can select the reports you want to show by selecting them on the left sidebar.
for gap traders:
- gap size and type
- distance to fill the target
- current fill percentage
- Bias based on live price action
for breakout traders:
- initial balance levels
- breakout extension percentage
- directional bias based on which level breaks
This dashboard automatically adapts to your watchlist. switch from ES to NQ to YM and instantly see the most relevant setup data for each contract.
Step 3: Configure the what's in play screener
While the dashboard analyzes one ticker, the screener shows the bigger picture across multiple instruments simultaneously. this is where you develop overall market bias...
Here's my exact setup: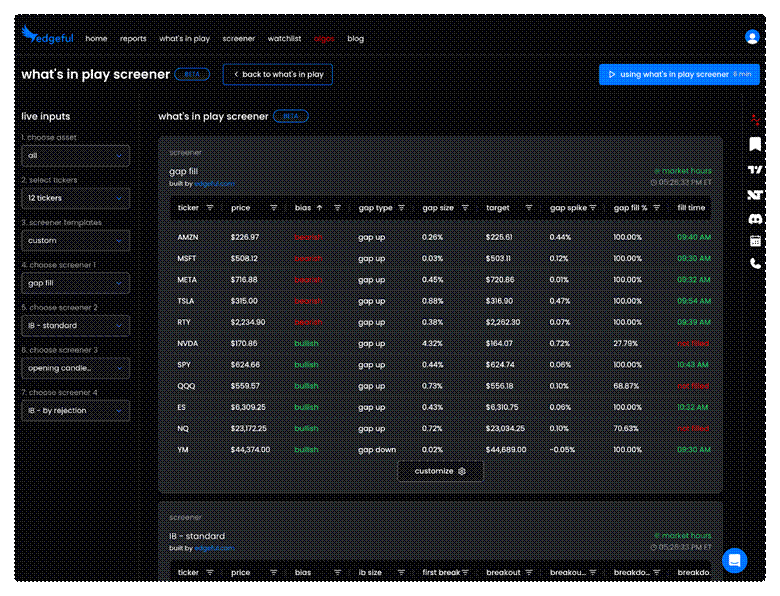
My daily tickers:
- ES, NQ, YM (the big 3 index futures)
- SPY, QQQ (for correlation)
- Mag 7 (GOOGL, AMZN, AAPL, META, MSFT, TSLA, NVDA)
My core reports:
- gap fill (quick trades off the open)
- initial balance standard (breakout momentum)
- opening candle continuation (session direction)
- previous day's range (key levels)
Example: it's 10:15 AM and your screener shows ES, NQ, and YM all broke below their initial balance lows. Based on historical data, this gives you a clear bearish bias, which you can use to align your trades with the trend throughout the rest of the session.
Instead of analyzing three charts manually, the screener tells you everything in seconds.
setup steps:
- Navigate to "Screener" tab
- Select "futures" asset type
- add ES, NQ, YM to ticker list
- Choose your 4 favorite reports
- pin tab and monitor all day
Step 4: Manage streaks and execute with confidence
This combines the two most critical final steps: understanding the win rate of your strategy (based on your own stats), and understanding this graphic:
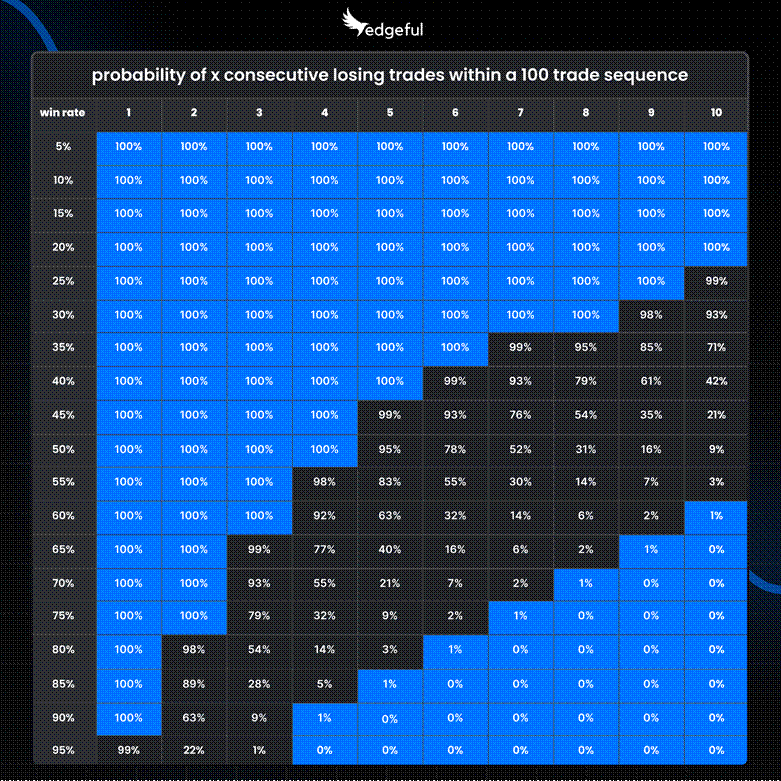
psychology of winning & losing streaks:
This chart shows the probability of experiencing X consecutive losing trades within a 100-trade sequence at different win rates.
With a 60% win rate — which is strong — you have:
- a 100% chance of experiencing 3 consecutive losses
- a 92% chance of experiencing 4 consecutive losses
- a 63% chance of experiencing 5 consecutive losses
So what’s the takeaway?
If you have a strategy that wins 60% of the time (which is better than most professional traders), you're virtually guaranteed to experience 4 consecutive losses at some point during a 100-trade sequence.
Now let's look at what happens with even better win rates:
- At a 70% win rate: you still have a 55% chance of 4 consecutive losses
- At a 65% win rate: you still have a 77% chance of 4 consecutive losses
- This is the reality that most traders aren't prepared for.
They find a strategy that works, but the first time they hit 3 or 4 losses in a row, they panic and abandon it — usually right before it would have started winning again.
So instead of bailing on your strategy after a couple of losses in a row, here’s what to do:
systematic confidence looks like:
- Understand the exact percentages of your setup using Edgeful reports
- Trade the setup accordingly
- Track your recent 10 or 20 trades — what’s the win rate?
- Check the graphic above and calibrate your mind accordingly
- . Continue to trade with confidence, knowing the stats support your strategy
No emotion. just data-driven execution.
Key Takeaways
Trading futures profitably isn't about perfect entries - it's about systematic processes that put probability on your side.
Your 5-step pre-trade checklist:
- Verify the setup's historical success rate with actual data
- Confirm setup forming in real-time with live conditions using the what’s in play dash
- Monitor multiple contracts using our screener for overall market bias
- Adjust position sizing based on recent performance
- Execute with confidence knowing data supports your decision
Stop trading on gut feelings. start trading with data.
This article contains sponsored content. Barchart has not reviewed, approved, or endorsed the content, and may receive compensation for placement of the content on this site. For more information please view the Barchart Disclosure Policy here.
/Super%20Micro%20Computer%20Inc%20HQ%20photo-by%20Tada%20Images%20via%20Shutterstock.jpg)

/Micron%20Technology%20Inc_billboard-by%20Poetra_RH%20via%20Shutterstock.jpg)
/Broadcom%20Inc%20logo%20on%20building-by%20Poetra_%20RH%20via%20Shutterstock.jpg)
