The information and opinions expressed below are based on my analysis of price behavior and chart activity
Tuesday, August 5, 2025
October Lean Hogs
If you like this article and would like to receive more information on the commodity markets from Walsh Trading, please use the link to join our email list -Click here
Every morning, at about 8 AM CST, I post a short video highlighting where I see opportunities in the futures markets. You can view my most recent video here
October Lean Hogs (Daily)
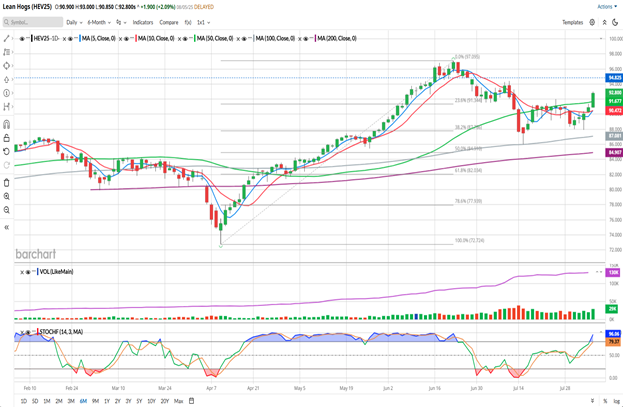
Today, October Lean Hogs settled at 92.800, gaining 1.900 on the day. The close also market the highest close since July 9th and the highest close above the 50-day moving average (green, 91.677) since the day after that. Yes, the October contract did settle above that average on July 21st, but only by 0.264. Today’s close was a little over 1.120 above the long-term average, which is supportive to my eye. The 5-and 10-day averages (blue/red, 90.505 and 90.472, respectively) also made a bullish crossover today, indicating a potential shift in trend to the upside. The longer-term averages on this chart, the 100- and 200-day averages (grey/purple, 87.081 and 84.907) are both well below the market and still inclined higher. That low on July 15th, came within 2 ticks of touching/testing the 50-day, but prices bounced higher before getting there. Stochastics (bottom sub-graph) are just getting into overbought territory. Looking back, you may notice that the market, basically, stayed overbought from the middle of April until almost the end of June. There’s a blue dotted line on the chart, overhead, near the 94.800 gap left from June 26-27. That seems like a reasonable target to my mind, but I would expect more from a move higher, potentially setting new contract highs above the June 18th 97.050 mark. I would not expect that to happen abruptly, but given the way the Livestock markets have traded this year, (have you seen Cattle prices!!??) I won’t be surprised if it happens quickly. A similar move (June 6th-23rd) took place over 10 trading days. You may also notice the Fibonacci levels on the chart (grey) I think it’s supportive that prices tested, and held, the 38% retracement near 87.780. No, it wasn’t a “hard floor” but support/resistance levels rarely are, in my experience.
Aggressive and well-margined traders may do well to consider long futures positions in October Lean Hogs. Perhaps looking for a test of the July 24th high, at 91.975, might offer a good entry point. If you did get in there, perhaps a risk/reverse Sell Stop just below the 5/10 day averages near 90.450 of so would work out well. That works out to be a risk of 1.525, or $610 per contract, before your commissions/fees. For a profit target, consider the gap at 94.800, for a potential gain of $1,130, before commission/fees or even new contract highs (if you have the patience) near 97.050, for a potential gain of 5.075, per contract, or $2,030 before commission/fees.
Less aggressive traders may do well to consider a long Call Option. October options have 70 days until expiration. The 95.000 Calls closed at 2.175 today, or $870 before commissions/fees. Set a GTC profit target at 2x what you paid for the option. If that order is executed, re-examine the market and see if it makes sense to do the same thing again. It will be a different strike price, at that time, but try not to spend more than you paid the first time around.
Call me directly, if you need additional suggestions.
If you like what you’ve read here and would like to see more like this from Walsh Trading, please Click here and sign up for our daily futures market email.
Every morning, at about 8 AM CST, I post a short video highlighting where I see opportunities in the futures markets. You can view my most recent video here
October Lean Hogs (Weekly)
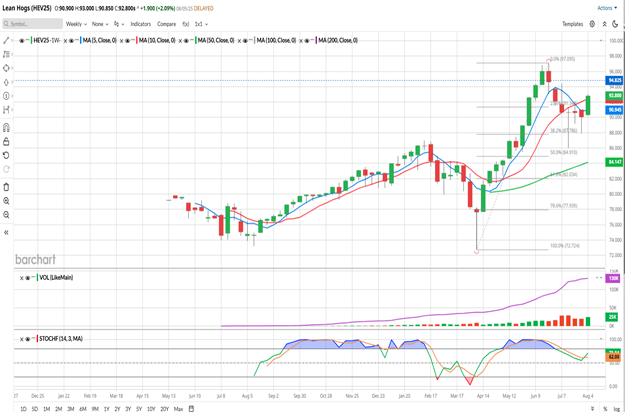
As of Tuesday’s close, the October Lean Hog contract is up 2.750 on the week, or a shade over 3%. I know, there’s still lots of “week” left to go, but the trade still looks friendly or bullish to my eye. If you look back 4 weeks (bars) you might notice that large trading range (91.250-86.025) during that week. I find a few things interesting about that week. First off, even with the huge range, the October contract closed that week about where it opened. With a weekly open at 90.650 and a close at 90.625, that’s about as large of a “Doji”, or equilibrium bar, that you might see. The Bulls had a chance to push prices higher, but didn’t get much traction. The Bears had a chance to push the trend lower, but couldn’t hold it. Everybody came back to where they started. You might see the Fibonacci levels, drawn roughly from the April low to the June high, displayed in grey on the chart. I think that it is very supportive that the 38% retracement level held, and while the market made a run at the 50% mark near 84.900, it never got there. The two weeks (bars) that followed, saw prices close within that large range, with the market unable to make any significant progress, up or down, until this week. As long as the market closes out the week above the 91.250 level, I’m of the opinion that prices are going back up. Currently, the market is above both the 5- and 10-week moving averages (blue/red). I see that they crossed into bearish territory a couple of weeks ago, but I think the close above those averages negates the bearish hook. In fact, the 5-week average is now turning higher, at 90.945 today, compared to last week’s reading of 90.805. And even though the bearish cross did happen, the 10-week average is still inclined higher. Those averages, at 90.945 and 94.425, should now become support, I think. The 50-week (green, 84.147) is well below the market and also inclined higher. Stochastics (bottom sub-graph) have relieved the overbought conditions that prevailed through May and June and are currently turning back higher. You may notice that this market stayed overbought for a long period last fall/winter, from September to February. That rally seemingly began in August of last year, before getting any type of significant pullback. Coincidentally, perhaps, we find ourselves at the same spot in the calendar now. Will this year result in another 6-month rally? Stay tuned!!
If you like what you’ve read here and would like to see more like this from Walsh Trading, please Click here and sign up for our daily futures market email.
Every morning, at about 8 AM CST, I post a short video highlighting where I see opportunities in the futures markets. You can view my most recent video here
Jefferson Fosse Walsh Trading
Direct 312 957 8248 Toll Free 800 556 9411
jfosse@walshtrading.com www.walshtrading.com
Walsh Trading, Inc. is registered as a Guaranteed Introducing Broker with the Commodity Futures Trading Commission and an NFA Member.
Futures and options trading involves substantial risk and is not suitable for all investors. Therefore, individuals should carefully consider their financial condition in deciding whether to trade. Option traders should be aware that the exercise of a long option will result in a futures position. The valuation of futures and options may fluctuate, and as a result, clients may lose more than their original investment. The information contained on this site is the opinion of the writer or was obtained from sources cited within the commentary. The impact on market prices due to seasonal or market cycles and current news events may already be reflected in market prices. PAST PERFORMANCE IS NOT NECESSARILY INDICATIVE OF FUTURE RESULTS. All information, communications, publications, and reports, including this specific material, used and distributed by Walsh Trading, Inc. (“WTI”) shall be construed as a solicitation for entering into a derivatives transaction. WTI does not distribute research reports, employ research analysts, or maintain a research department as defined in CFTC Regulation 1.71.

/Amazon%20-%20Image%20by%20bluestork%20via%20Shutterstock.jpg)
/Salesforce%20Inc%20HQ%20building-by%20JHVEPhoto%20via%20Shutterstock.jpg)

/Semiconductor%20close%20up%20by%20Yosi%20Azwan%20via%20iStock.jpg)