Jon Wiedeman 8/05/2025
If you would like to receive more information on the commodity markets or would like to open an account, please click the link Sign Up Now
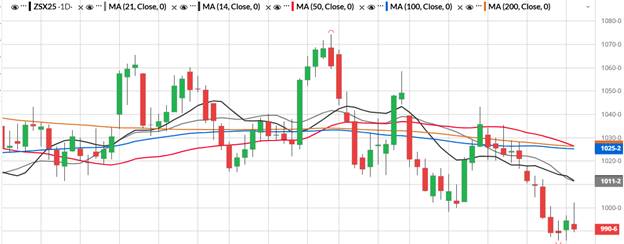
Daily ZSX5:
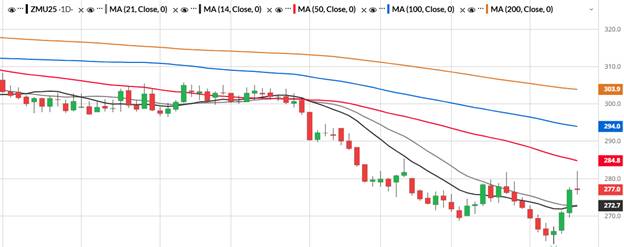
November beans traded above the $10 level but ended up closing lower on the day. Continue to watch the 986 level which is a double bottom from last Fridays low as well. We will be using that for support as well as the April 9th low of 971 ¼. Soybean meal has been very strong over the last four trading sessions and it’s looking like it wants to test the 50 day moving average of 284.8 of the September contract. Looking at November beans on the daily charts we have some resistance above at 1011 ¼ which is the 21 day moving average and 1011 ½ which is the 14 day. Longer term moving averages come in at 1025 ¼ (100 day) and 1026 ½ (both the 50day and 200 day moving average). See chart below.
September Soybean Meal Smu25 Daily Chart:
Weekly ZSX5:
Looking at November beans on the weekly charts we have support at 986 which is last weeks low and currently this week low as well, below that we have 971 ¼ which is the April 9th low. If we get above last week high of 1018 ¼ in my opinion we are going to test the cluster of moving averages above the market. Those are sitting at 1027 (21 day) 1030 (14 day) and lastly 1032 (50 day) see chart below.
Fundamentals:
Soybean crop conditions did decline 1% to 69% in the good to excellent category yesterday afternoon. This is compared to 68% last year. The US weather remains to look favorable for the 6-10 day forecast as well. Stone X came out with their customer survey for August with a yield of 53.6 BPA! With the elephant in the room being China and getting a trade deal finalized we need to keep a close eye on highlines over the next few weeks.
Trade Ideas:
Keep an eye on the 50 day moving average in Sep meal which is at 284.8 to take some profit if you are long meal in my opinion and using the 273.0 level as support to take a stab at buying September Soybean meal.
Daily ZCZ5:
December corn made a new contract low in the overnight market trading down to 401 ½. The market continues to want to test the $4 dollar level which I am guessing some longs are leaning on for support in the market. Looking at the daily charts we have Sunday nights high of 412 ¾ then some resistance at 415 ½ which is the 14 day moving average and then followed by 415 which is the 21 day. See chart below.
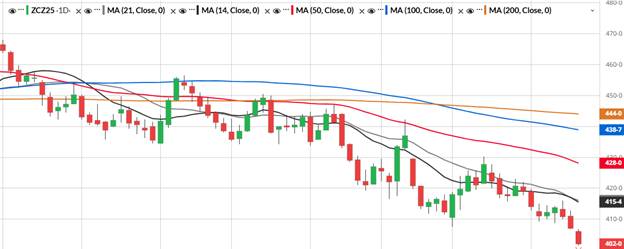
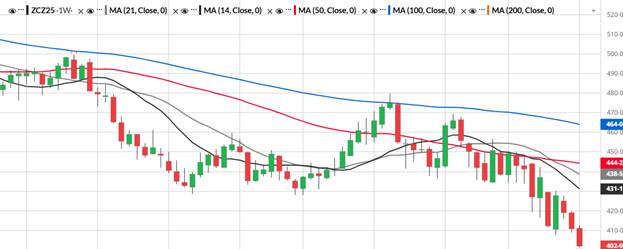
Weekly ZCZ5:
Looking at the longer-term charts we have support in December corn at the psychological $4 level. With corn also making lower highs on the weekly charts for the past three weeks the market acts heavy and wants to see what’s below the $4 in my opinion. With resistance coming in at last weeks high of (419) and the moving averages on the weekly’s coming in at (431) for the 14 day (438 ½) for the 21 day and lastly (444 ¼) for the 50 day (see chart below).
Fundamentals:
December corn crop conditions were unchanged at 73% good to excellent which led Dec corn to make a new contract low in the overnight trading session. Stone X came out with their customer yield survey for August at a 188 BPA! We will continue to watch the weather forecasts and also keep an eye on the Midwest crop tours which usually start towards the Middle to end of August.
Trade Ideas:
Sitting tight and waiting to see how market acts around the $4 level and see if we can get some positive demand news.
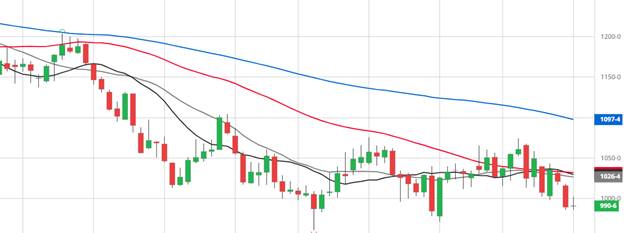
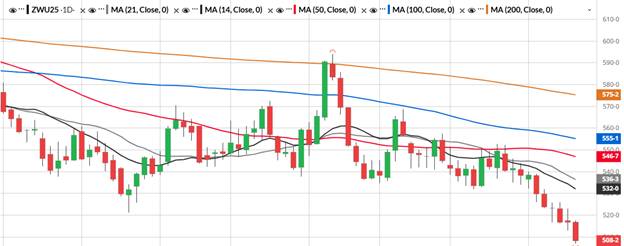
Daily ZWU5:
September wheat also made a new contract low during the day session at 507. With wheat harvest underway and some harvest pressure hitting the market. The daily moving averages which we are using as resistance are coming in at the 14 day (532), 21 day (536 ¼), 50 day (546 ¾) and lastly the 100 day (555 ½) (see chart below). Keep an eye on the $5 psychological level in Sep wheat.
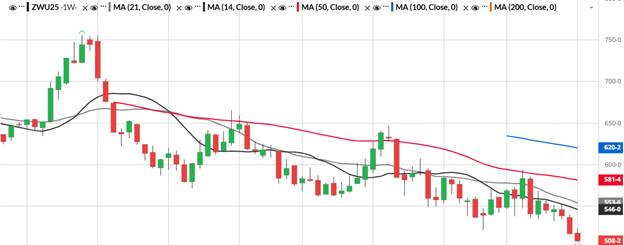
Weekly ZWU5:
Wheat continues to grind lower and making contract lows with lack of fresh bullish news. Looking at the weekly charts we have last weeks high at 540 for resistance. As far as the weekly moving averages they are coming in at (546) for the 14 day, the 21 day at (553 ¾) the 50 day (581 ½) and lastly the 100 day at (620 ¼) (see chart below).
Fundamentals:
Wheat continues to grind lower and making new contract lows with no fresh news and harvest pressure coming into the market. In my opinion wheat is oversold but we are staring at the $5 level which is near. Keep an eye on any news that could spark some short-term buying interest.
Trade Ideas:
With the market turned down and below the moving averages, I am sitting tight in the wheat market. I will be watching the $5 level in wheat and try to find a place to get long the market with it being oversold.
If you would like to receive more information on the commodity markets or would like to open an account, please click the link Sign Up Now

Jon Wiedeman
Pure Hedge Division
Direct: 1 312 957 8108
WALSH TRADING INC.
311 S. Wacker Suite 540
Chicago, Illinois 60606
Walsh Trading, Inc. is registered as a Guaranteed Introducing Broker with the Commodity Futures Trading Commission and an NFA Member.
Futures and options trading involves substantial risk and is not suitable for all investors. Therefore, individuals should carefully consider their financial condition in deciding whether to trade. Option traders should be aware that the exercise of a long option will result in a futures position. The valuation of futures and options may fluctuate, and as a result, clients may lose more than their original investment. The information contained on this site is the opinion of the writer or was obtained from sources cited within the commentary. The impact on market prices due to seasonal or market cycles and current news events may already be reflected in market prices. PAST PERFORMANCE IS NOT NECESSARILY INDICATIVE OF FUTURE RESULTS.
All information, communications, publications, and reports, including this specific material, used and distributed by Walsh Trading, Inc. (“WTI”) shall be construed as a solicitation for entering into a derivatives transaction. WTI does not distribute research reports, employ research analysts, or maintain a research department as defined in CFTC Regulation 1.71.

/Amazon%20-%20Image%20by%20bluestork%20via%20Shutterstock.jpg)
/Salesforce%20Inc%20HQ%20building-by%20JHVEPhoto%20via%20Shutterstock.jpg)

/Semiconductor%20close%20up%20by%20Yosi%20Azwan%20via%20iStock.jpg)