WALSH PURE SPREADER
Pure Hedge Division
RICH MORAN 2/20/2026
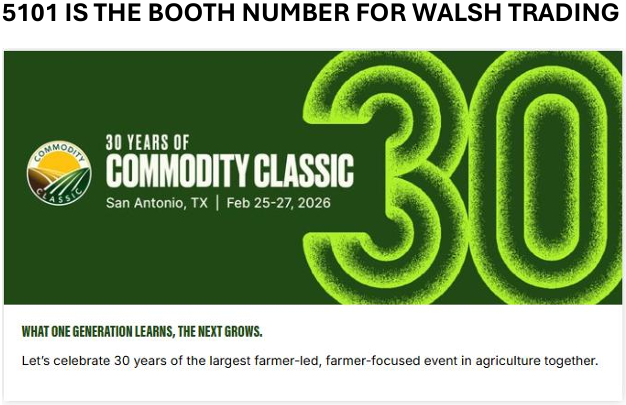
We have our booth #5101 next week at the COMMODITY CLASSIC Trade Show in San Antonio.
Please stop by and say hello. It will be great to see you!
COTTON MARKET UPDATE
It still appears to me that there might be some good opportunities in the cotton market. A couple days ago (Wed., 2/18), I wrote an article suggesting to buy the MAY-JULY ’26 COTTON SPREAD (CTK26-CTN26) if it was able to trade above and settle above the 14-day and 21-day moving averages. It did get there the next day (yesterday, 2/19). Please see Wednesday’s article for the details on that trade suggestion.
For at least two years cotton has been trending down from around 80 cents in March of 2024 to below 63 cents earlier this month. As I mentioned on Wednesday, The National Cotton Council (NCC) released its Annual Early Season Planting Intention Survey last week. According to the survey, at this point, U.S. growers intend on planting about 3.2% less acres of cotton this year. This is a result of the current low price of cotton and the fact that the current margins can be better for growers in other crops. Soybeans, for example, are simply less expensive to plant.
WASDE just projected that they expect planted acreage for cotton this year (2025/26) to be 9.28 million acres. That is a drop from 11.18 million planted acres last year (2024/25). I wouldn’t be surprised if this year’s number ends up being only about 7½-8 million acres planted. WASDE’s latest report also shows the expected U.S. Ending Stocks this year to be around 4.40 million bales. I think that number could be closer to 3.5 or 4 million. It is simple supply and demand. They are looking to lower the supply of cotton by planting less acres. This can bring the price of cotton up as world demand seems to be holding steady.
The cotton market could be a real good place for us to keep an eye on. There might be great chances for us take advantage of in the cotton market this year. The trading strategies would be through flat price trading, futures spreads, options and option spreads as well. Please reach out to me with any questions or thoughts you may have on this.
If you have any thoughts/questions on this article or any questions at all in regard to the commodities futures markets, please use this link Sign Up Now
Following up on still active past trade suggestions:
- 2/18/2026: CTK26-CTN26 (MAY-JULY ’26 COTTON SPREAD)****On 2/19/26 – This spread traded up above and settled above the 14-day and the 21-day moving averages. I am suggesting that when the market opens on Sunday night, try to buy CTK26-CTN26 at -1.58 cents or better (just above yesterday’s settlement price). Risk 0.33 cents or $165 Per Spread to make 0.99 cents or $495 Per Spread plus fees and commissions.
The chart for MAY COTTON(CTK26) has been on a downward trend for about six months since it was trading just above 71 cents last August of 2025. Today it settled at 63.76 cents. The chart for the MAY-JULY ’26 COTTON SPREAD (CTK26-CTN26) is a very similar looking chart over the same timeframe. The chart for the spread has been trending downwards as well after trading -0.62 cents on 8/25/25. Today this spread settled -1.71 cents. Since 2/6/26, almost two weeks now, both of these charts have now been floating around above their 52-week lows, again with a very similar looking chart pattern.
The National Cotton Council (NCC) released its Annual Early Season Planting Intention Survey last week. At this point, U.S. growers intend to plant about 3.2% less acres of cotton this year. This is a result of the current low price of cotton and the fact that the margins are better right now with other crops. It looks like they are hoping that a lower supply of cotton will help bring the price of cotton back up as world demand seems to at least be holding steady.
The CTK26-CTN26 (MAY-JULY ’26 COTTON SPREAD) has been hovering just below the 14-day and 21-day moving averages for about a month-and-a half. It has recently started to touch the 14-day and is getter close to the 21-day as well.
I think with the industry’s focus on the price of cotton and its relatively low price, this might be a good “risk/reward” level to buy CTK26-CTN26 if it can trade above and settle above both the 14-day and 21-day moving averages.
We can pick out exact exit points if and when we put this trade on.
- 2/13/2026: LEM26-LEQ26 (JUNE-AUG ’26 LIVE CATTLE SPREAD)
****On 2/18/26 – This spread traded down below 2.425 (please see below) and got down to 2.225, so we are long (on paper) at 2.425. Risk 0.85 (price of 1.575) or $340 To Make 1.95 (price of 4.375) or $780 Per Spread, plus fees and commissions.
This week April Live Cattle Futures (LEJ26) continued to float around about 10 Dollars below the 52-week high of 250.925. It traded between 237.275 and 241.675 this week, settling today at 240.625. It has been trading pretty much sideways with a slight upward trend for over a month.
The current cash market has been trading above the futures market. Today, for example, this afternoon’s “Mandatory Report” showed live cattle trading today at $245. Word on the street is that it traded $248 in Texas after that report. I think there might be room for live cattle futures to at least test their 52-week highs, maybe even make new highs.
The JUNE-AUG ’26 LIVE-CATTLE SPREAD (LEM26-LEQ26) opened today steady at yesterday’s settlement price of 2.175. This was below both the 14-day and 21-day moving averages. It was able to trade up above, and settle above, both of these moving averages at 2.425.
With the cash market trading comfortably above the futures market and with the bullish move today in LEM26-LEQ26, I believe it could be a good time to buy this spread. I am suggesting that when the market opens next week, try to buy LEM26-LEQ26 (JUNE-AUG ’26 LIVE-CATTLE SPREAD) at today’s settlement price of 2.425 or better. If you are unable to buy it at this price on the opening, I recommend leaving a bid in at 2.425.
If and when we are able to buy this spread, we can/will choose our exact exit levels. In any case, if you do get long this spread. I suggest exiting the trade if it trades down to 1.575.
- 2/11/2026: ZSK26-ZSU26 (MAY-SEPT ’26 SOYBEAN SPREAD)
**** On 2/12/26 – This spread opened higher at +31½ and traded straight up to +32¼. So (on paper), we had a better sell fill at +31½, but we were quickly stopped out at 32¼ (please see below). It turned out to be a very quick trade, but we only lost ¾ of a cent or $37.50 Per Spread, plus fees and commissions.
On February 4th (1 week ago today) Trump made the announcement that after “very positive” talks with China’s President Xi Jinping, it looked like China may be increasing its purchase of U.S. soybeans from 12 million metric tons up to 20 million metric tons. This caused March Soybean Futures (ZSH26) to rally more than 55 cents, from its low that day of $10.59½ cents per bushel up to its high of $11.15¼. I believe this may have been an over-reaction to Trumps interpretation of the discussion.
This higher cost for U.S. soybeans could reduce the demand for our soybeans. I also believe that with soybeans at these prices, we may see an increase of hedgers taking advantage of this opportunity. We have world ending stocks for soybeans at or near record highs as well.
I think a nice way to fade this recent rally in soybeans is to sell the MAY-SEPT ’26 SOYBEAN SPREAD (ZSK26-ZSU26). This spread settled today 82.70 over full carry. Full carry for this spread is 55.95 and the spread settled today at +26¾ (55.95 + 26.75 = 82.70). Markets trade above full carry all the time, but this might be a little more than usual, making it possibly a good risk/reward play when considering how far the spread is trading above Full Carry.
I am suggesting that when the market opens this evening, try to sell ZSK26-ZSU26 at +27¾ or better. If you are unable to sell it at this price on the opening, I recommend leaving an offer in at +27¾.
If and when we are able to sell this spread, we can/will choose our exact exit levels. In any case, if you are able to get short the spread, look to exit the trade with a short stop if it trades up to +32¼.
- 2/6/2026: ZCN26-ZCZ26 (JULY-DEC ’26 CORN SPREAD)
Today’s Settlement: -16¼, 14 Day Moving Average: -14¾, 21 Day Moving Average: -13¾
Today, the JULY-DEC ’26 CORN SPREAD (ZCN26-ZCZ26) made a new 14-day high at -11½. This 14-day high was just above both the 14-day moving average (-12¾) and the 21-day moving average (-12). ZCN26-ZCZ26 did manage to settle above 14-day, but it could not maintain the strength to stay above the 21-day and it settled a ½ cent below that at -12½.
Managed money is net short about 50,000 corn futures. If they start to liquidate these positions, this could bring a bid to the corn market. In addition, soybeans had a very strong week. They settled up 50 cents for the week. With this increase in bean prices, the market might find some value in corn, giving corn another reason to strengthen.
I think if we can get ZCN26-ZCZ26 (JULY-DEC ’26 CORN SPREAD) back up above both the 14-day and the 21-day moving averages, and settle above them both, we should look to buy this spread with a short stop just below the 52-week low of -15¼. at -18¼ (updated on 2/18/26).
If and when we get long this spread, we can pick our exact exit points.
- 2/4/2026: ZLQ26-ZLZ26 (AUG-DEC ’26 SOYBEAN-OIL SPREAD)
Today’s Settlement: +1.23, Working a +0.84 Bid
I am still a big fan of buying the SOYBEAN-OIL SPREADS. Nothing is always in commodity futures, but in general, soybean-oil spreads will follow the direction of the outright soybean-oil market. It looks like they might be increasing the soybean-oil blend rates and that could also strengthen the soybean-oil market. If the soybean-oil market upticks or rallies, the soybean-oil spread market may get stronger as well.
I have already written about and suggested getting long the MARCH-JULY SOYBEAN-OIL SPREAD (ZLH26-ZLN26) and the MAY-AUG SOYBEAN-OIL SPREAD (ZLK26-ZLQ26). I would like to add one more soybean-oil spread that you may want to buy. I also like buying the AUG-DEC ’26 SOYBEAN-OIL SPREAD (ZLQ26-ZLZ26). I believe all three of these soybean-oil spreads could make moves up.
If you are already long the MARCH-JULY spread and choose to sell and get flat that spread to buy ZLQ26-ZLZ26, that is obviously understood and could reduce your exposure.
If you keep the MAY-AUG spread and buy the AUG-DEC spread, the AUG’s will cancel each other out you will actually be long the MAY-DEC soybean-oil spread in your position or on your statement. I would still be looking at this as two separate spreads. If we do decide to get out of both positions at the same time, we can just sell the MAY-DEC spread to be flat in both the MAY-AUG spread and the AUG-DEC spread.
If you are not in the SOYBEAN-OIL SPREAD market yet, I suggest buying the AUG-DEC ’26 SOYBEAN-OIL SPREAD (ZLQ26-ZLZ26). This will now give you more time than the first two spreads and there will not be the need to roll a position.
Because we are already long 2 SOYBEAN-OIL SPREADS, we can be a little patient by putting a bid in slightly below today’s settlement. When the market opens this evening, I suggest trying to buy ZLQ26-ZLZ26 (AUG-DEC ’26 SOYBEAN-OIL SPREAD) at +0.84 or better. If you are not able to buy the spread at this level on the opening, leave a resting bid in at +0.84. We can choose our exact exit points if and when we are able to establish this position. In any case, if you are able to buy this spread, look to get out if it trades down to +0.22.
- 1/23/2026: KCN26-KCU26 (JULY-SEPT ’26 COFFEE SPREAD)
Today’s Settlement: 4.40, 14 Day Moving Average: 4.50, 21 Day Moving Average: 4.85
JULY-SEPT ’26 COFFEE SPREAD (KCN26-KCU26) has been hovering below the 14-day and 21-day moving averages since the start of its recent downward trend that began on 11/6/25. This spread started to stabilize at the beginning of this year at around 6.00. As this started to happen, the chart naturally began to flirt with both of these moving averages.
Brazilian coffee exports are down. This could help explain the recent halt in the bearish move in the spread. Also, drier weather in Brazil seems to be having the same effect on things.
I am suggesting that if KCN26-KCU26 trades above and settles above both the 14-day and the 21-day moving averages, we should try getting long this spread with a short stop just below the 52-week low. We can choose our exact exit points when and if we are able to put this trade on.
1/16/2026: ZLK26-ZLQ26 (MAY-AUG ’26 SOYBEAN-OIL SPREAD)
Today’s Settlement: +0.23, Long at: -0.13
**** On 2/6/26 – We now have a nice lead on this spread. I hate turning a winner into a loser so I am suggesting to move our stop to -0.13 for a scratch. We are now Risking a scratch (price of -0.13) to make 66 tics (price of +0.53) or $396 Per Spread, plus fees and commissions.
**** On 1/26/26: ZLH26-ZLN26 traded -0.14 on so we are long (on paper) at -0.13. (please see below). Risking 22 ticks (price of -0.35) or $132 to make 66 ticks (price of +0.53) or $396 Per Spread, plus fees and
I am suggesting that when the market opens on Monday evening, we could try to buy ZLK26-ZLQ26 at -0.13 cents (today’s settlement) or better. If we open higher than that, just leave a -0.13 resting bid in. We are already long (on paper) ZLH26-ZLN26 so we can be a little patient with this this one. We can pick our exact exit points if and when we are able to put this trade on. In any case, if you do get long this spread, I would stop yourself out at -0.36 cents.
- 1/14/2026 ZWK26-ZWN26 (MAY-JULY ’26 Wheat Spread)
Today’s Settlement: -7¼, Long at -11
**** On 2/13/26 – We now have a nice lead on this spread. I hate turning a winner into a loser so I am suggesting to move our stop to -11 for a scratch.
We are now Risking a scratch (price of -11) to make 7½ cents(price of -3½) or $396 Per Spread, plus fees and commissions.
**** On 1/29/26: ZWK26-ZWN26 traded -11¼, so we are long (on paper) at -11. Risk 2½ cents (price of -13½) or $125.00 Per Spread to make 7½ cents (price of -3½) or 375.00 Per Spread plus fees and commissions.
**** On 1/27/26: “ZWK26-ZWN26 traded and settled above both the 14-day and 21-day moving averages (please see below). I am suggesting to try to buy this spread at -11 or better.”
I am suggesting that if we can trade above and settle above both the 14-day and the 21-day moving averages, we should try to get long this spread. We can pick our exact exit points when and if we are able to put this trade on.
- 12/17/2025 ZLH26-ZLN26 (MAR-JULY ’26 SOYBEAN-OIL SPREAD)
Today’s Settlement: -0.52, Long at -0.79
****Thursday (12/18/25): Shortly after the market opened Thursday (12/18/25) morning, we would have been able to buy -0.79’s in ZLH26-ZLN26 (MAR-JULY SOYBEAN-OIL SPREAD). It did trade -0.80.
When that happened, it was -0.53 bid in ZLH26 (JAN-MAR ’26 SOYBEAN-OIL SPREAD), so we were able (on paper) to sell out and get flat that spread at -0.53. This was for a 1 tick or $6.00 loss, plus fees and commissions.
Risk 22 ticks (price of -1.01) or $132 to make 66 ticks (price of -0.13) or $396 Per Spread, plus fees and commissions.
- 10/1/2025: SBH26-SBK26 (MAR-MAY’26 Sugar #11 Spread)
Today’s settlement: 0.43, Long at 0.42
On 10/1/25 I said, “I think it might be a good play to bid today’s settlement (42 cents) or better when the Sugar market opens.”
On 10/2/25 the market opened at .41, so we are long at .42.
Risk 24 cents (price of .18) or $268.80 Per Spread to make 50 cents (price of .92) or $560.00 Per Spread plus fees and commissions.
If you have any thoughts/questions on this article or any questions at all in regard to the commodities futures markets, please use this link Sign Up Now
Rich Moran
Senior Commodities Broker
Direct: (312)985-0298
Walsh Trading, Inc. is registered as a Guaranteed Introducing Broker with the Commodity Futures Trading Commission and an NFA Member.
Futures and options trading involve substantial risk and is not suitable for all investors. Therefore, individuals should carefully consider their financial condition in deciding whether to trade. Option traders should be aware that the exercise of a long option will result in a futures position. The valuation of futures and options may fluctuate, and as a result, clients may lose more than their original investment. The information contained on this site is the opinion of the writer or was obtained from sources cited within the commentary. The impact on market prices due to seasonal or market cycles and current news events may already be reflected in market prices. PAST PERFORMANCE IS NOT NECESSARILY INDICATIVE OF FUTURE RESULTS. All information, communications, publications, and reports, including this specific material, used and distributed by Walsh Trading, Inc. (“WTI”) shall be construed as a solicitation for entering into a derivatives transaction. WTI does not distribute research reports, employ research analysts, or maintain a research department as defined in CFTC Regulation 1.71.

/Microsoft%20sign%20at%20the%20headquarters%20by%20VDB%20Photos%20via%20Shutterstock.jpg)


/Space/Cargo%20spacecraft%20in%20low-Earth%20orbit%20by%20Paopano%20via%20Shutterstock.jpg)