Chart of the Day
The information and opinions expressed below are based on my analysis of price behavior and chart activity
Sign Up to receive Walsh Trading’s 1st Half of 2026 Market Outlook First Half of 2026 Outlook for the Livestock and Grain markets.
Thursday, February 19, 2026
If you like this article and would like to receive more information on the commodity markets from Walsh Trading, please use the link to join our daily email list -Click here
May Wheat (Daily)
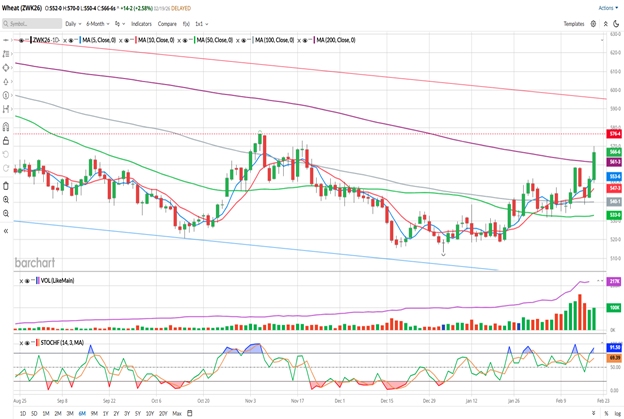
May Wheat settled at 5.66 ¾ today, up 14 ¼, gaining 2.58% on the day and leading the Grain/Soy markets higher. This marks the highest close since November 18th. This market closed strong, with the daily high being set in the last 5 minutes of the trade today. Today’s close also marks the first close above the 200-day moving average (purple) since June 18th, which can be a strong signal of trend. The 5- and 10-day moving averages have held as support so far this week and are at 5.53 ¾ and 5.47 3/8, shown in blue/red, respectively. Those 2 averages made a bullish crossover one week ago and are pointed higher. The 100-day average (grey, 5.40 ¼) has acted as support since February 11th and appears to be flattening out. The 50-day average (green, 5.33) also appears to be flattening this month. Those two averages are still in a bearish configuration, and have been since May of last year. As you might surmise, it may take a while (and more price strength) to get those to turn bullish. But overall, the chart is showing signs of bullish life!
Stochastics (bottom sub-graph) are just ticking into an overbought condition. I think it’s interesting to note that we’re currently in the longest stretch of Wheat not being oversold. By looking at the chart above, it seems that it usually goes back to oversold with in about 2 weeks or so. Currently, Wheat hasn’t been oversold since Jan 2nd, which was the contract low! It’s been a slow build since then, but things are looking more favorable for the bulls.
Today the USDA Outlook Conference began. There was no major adjustment to in their Wheat outlook. The pegged the average yield at 50.8 bpa, down from 53.3 in the Feb. WASDE. Production is estimated at 1.860 billion bu, down from 1.985 in the most recent WASDE. Ending Stocks have been estimated at 933 million bu, up slightly from 931 in the Feb. WASDE. I don’t think any of that data warrants a 14 cent rally, by itself. However, Trade Sentiment may be shifting to the bull side in Wheat, and it will take time to accurately assess that.
So how can you trade it?
Aggressive and well-margined may do well to consider long futures positions in May Wheat. Either the 200-day average at 5.61-ish or last week’s high of 5.58 ¾ may offer good support levels. I’d rather hold out for a lower price, look toward the 5-day moving average, at 5.53 ¾ today, as an entry. (that number will be higher following tonight’s 7 PM open) Initially, I might suggest a GTC Sell Stop near yesterday’s low of 5.42 ¼. That would work out to be a potential 11 ½ cent risk, or $575 per contract, before your commissions/fees. Look to exit that trade near the October high (dotted red horizontal) of 5.76 ½. That would work out to a potential gain of 22 ¾ cents, or $1,137.50 per contract, before your commissions/fees.
Less aggressive traders, or those that prefer options, may do well to consider long Call options. May options expire in 64 days. May 575 Calls settled at 21 1/8 today, or $1,056.25. I would suggest trying to buy those for 20 cents, or $1,000, before your commissions/fees. Risk ½ of what you paid for the option and look to take profit at 2x what you paid for it. Those that prefer Call Spreads, may do well to consider selling the May 625 Call against the 575. Those options settled at a 12 ½ cent difference today. Perhaps buying that spread for 10 cents, or $500 per spread, before your commissions/fees would offer you good value.
Wheat producers may do well to consider some grain out of the bin, if you still have it, if May futures hit 5.75 and again at 6.00. The Call strategies outlined above may help add to your bottom line, if the market cooperates, and you want to re-own some of what you’ve sold. You’re going to receive about $28,000 (less your local basis) for every 5,000 bushels you sell. To re-own that though a $500 call spread may work out in your favor. You still get to participate in market upside, don’t have to worry about basis and will no longer have any costs associated with storage.
(Weekly)
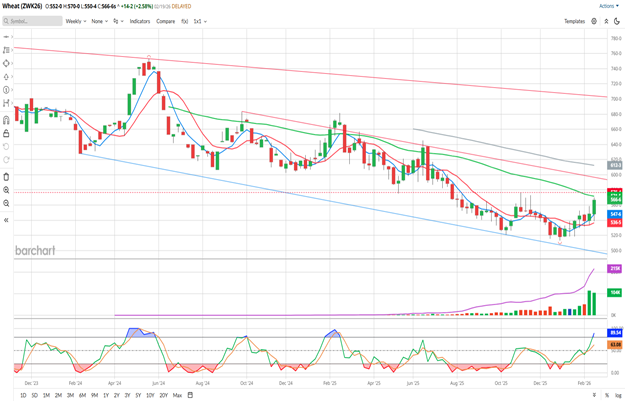
So far this week, May Wheat has gained 18 ¼ cents, nearly doubling last weeks gain of 9 ½ cents. If we close the week here, this would be the highest weekly close since the first week of April last year. The 5- and 10-week moving averages (blue/red) made a bullish crossover the first week of this month. That is a strong bullish sign, in my opinion, but the past 2 bullish crosses only lasted 4 weeks and we’re into week 3 of this one. Those weekly averages are at 5.47 ¾ and 5.36 5/8, respectively. The 50-week average (green, 5.71 5/8) seems to have offered resistance throughout it’s life on this chart, but we haven’t quite gotten there to test it this time around. If that average is tested again, that would mark the 4th attempt by my count, measured by a weekly close above that average. Perhaps the 5th time will be the charm for the bulls. The 100-week average (grey, 6.12 3/8) is still well above the market and should be a hedge target for producers out there, I think. Weekly Stochastics (bottom sub-graph) are just starting to get into overbought status by ½ of the metric. We’ll have to stay tuned to see if it reaches fully overbought, a condition this market has not liked over the 2+ years shown on the chart. The weekly chart is showing signs of a bullish turn, but more confirmation is needed, I think, before I would turn into a full-on Wheat bull. You might notice the 2 red trendlines that I’ve drawn on the chart above. The closest is drawn off highs in September ’24 and June ’25. Today, I’d peg that trendline at about 5.95, just shy of the big, fat round number of 6.00.
You can view Barchart’s Seasonal Data here. February and March appear to be weaker for Wheat prices over half the time, over the past 15 years. It’s not unprecedented, but this is not usually a time for a seasonal rally in Wheat. However, you might notice the February-May 2024 period on the weekly chart above. During that time the market rallied over $1.25 before the bulls bailed out around the $7.50 level.
Sign Up to receive Walsh Trading’s 1st Half of 2026 Market Outlook First Half of 2026 Outlook for the Livestock and Grain markets.
If you like what you’ve read here and would like to see more like this from Walsh Trading, please Click here and sign up for our daily futures market email.
Jefferson Fosse Walsh Trading
Direct 312 957 8248 Toll Free 800 556 9411
jfosse@walshtrading.com www.walshtrading.com
Walsh Trading, Inc. is registered as a Guaranteed Introducing Broker with the Commodity Futures Trading Commission and an NFA Member.
Futures and options trading involves substantial risk and is not suitable for all investors. Therefore, individuals should carefully consider their financial condition in deciding whether to trade. Option traders should be aware that the exercise of a long option will result in a futures position. The valuation of futures and options may fluctuate, and as a result, clients may lose more than their original investment. The information contained on this site is the opinion of the writer or was obtained from sources cited within the commentary. The impact on market prices due to seasonal or market cycles and current news events may already be reflected in market prices. PAST PERFORMANCE IS NOT NECESSARILY INDICATIVE OF FUTURE RESULTS. All information, communications, publications, and reports, including this specific material, used and distributed by Walsh Trading, Inc. (“WTI”) shall be construed as a solicitation for entering into a derivatives transaction. WTI does not distribute research reports, employ research analysts, or maintain a research department as defined in CFTC Regulation 1.71.

/Microsoft%20sign%20at%20the%20headquarters%20by%20VDB%20Photos%20via%20Shutterstock.jpg)


/Space/Cargo%20spacecraft%20in%20low-Earth%20orbit%20by%20Paopano%20via%20Shutterstock.jpg)