
Tuesday is the last day of June, meaning the financial quarter (Q2) comes to an end as well. The day will include the release of the June Consumer Confidence Index.
US stock indexes hit record highs during June, though both the S&P 500 and Nasdaq are in position to completed bearish long-term technical patterns on monthly charts.
As for the Grains sectors, the spotlight will be on USDA's annual Acreage update and quarterly Grain Stocks reports.
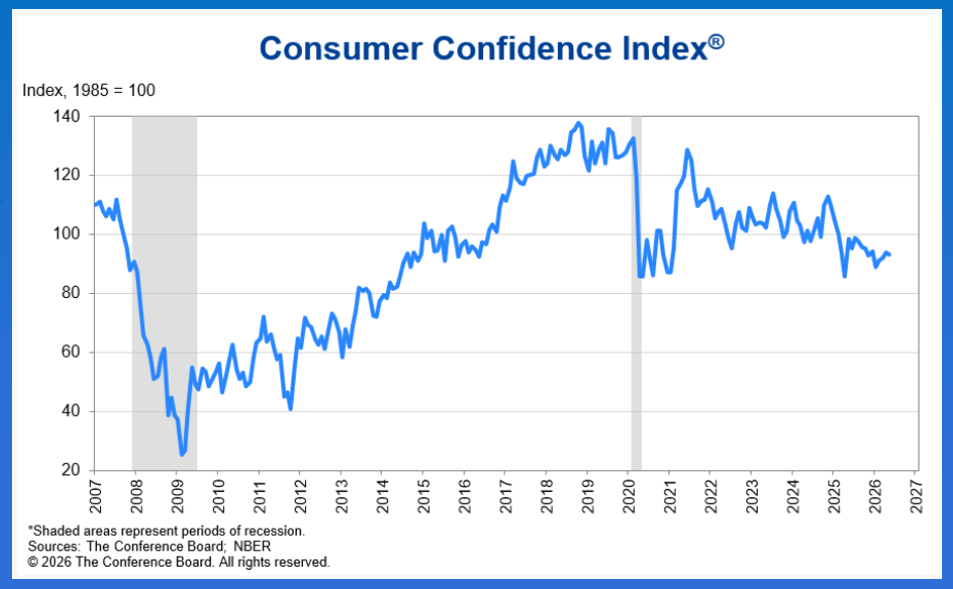
Morning Summary: Is it just me, or did June fly by? As we begin the last trading day of the month, financial interests are approaching the last day of the quarter (Q2), with all three major US stock indexes hitting new all-time highs this month. However, barring a miraculous rally in both the S&P 500 ($INX) and Nasdaq ($NASX), these indexes are in position to complete long-term bearish reversal patterns on their monthly charts. If that means anything anymore. Which I have argued it doesn’t. Pre-dawn Tuesday finds the Indices sector (US stock index futures) of the commodity complex in the green across the board. Asian equity markets posted a mixed close while European markets were higher at midday. In related news, US cattle markets closed lower Monday despite reports of strong cash markets – both live and feeder – heading into last weekend. What stood out to me as Monday played out was at least some of the pressure came from the commercial side. Is the US cattle and beef industry nearing a tipping point? We’ll get the June consumer confidence index later this morning, with the median guess of “experts” coming in at 94.6, with last month’s number at 93.1 (before a likely revision).
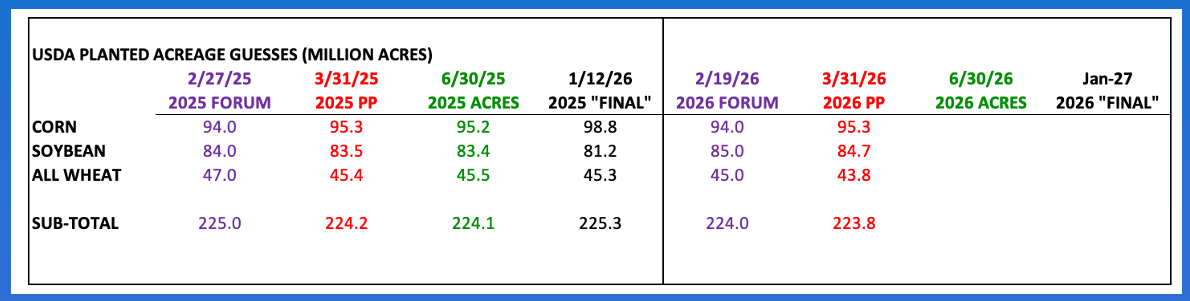
Corn: Speaking of government numbers and quarters, in the Grains sector Tuesday brings USDA’s annual Acreage update and quarterly Grain stocks numbers. In the corn market, most of today’s hullabaloo will be about planted acres with market bulls hoping for a Hail Mary while market bears look for the final nail in King Corn’s coffin. In reality, this will be the fourth official look at 2026 acreage (fifth if we count Groundhog Day), with an interesting pattern developing in corn. If you look closely at a comparison between the numbers USDA has come up with so far, particularly the Forum and Prospective Plantings figures, they are the same as last year’s. For a group known for its imagination when it comes to creating supply and demand “data”, this shows a serious lack of the same. If today’s acreage update figure follows this same pattern and comes in at 95.2 million (ma), down slightly from the Prospective Plantings guess of 95.3 ma, it could be enough to trigger Watson into buying. Keep in mind Dec corn is showing oversold momentum numbers on both its daily and weekly charts while futures spreads cover neutral-to-bullish levels of calculated full commercial carry. This could be enough to bring some fund buying back to the market.
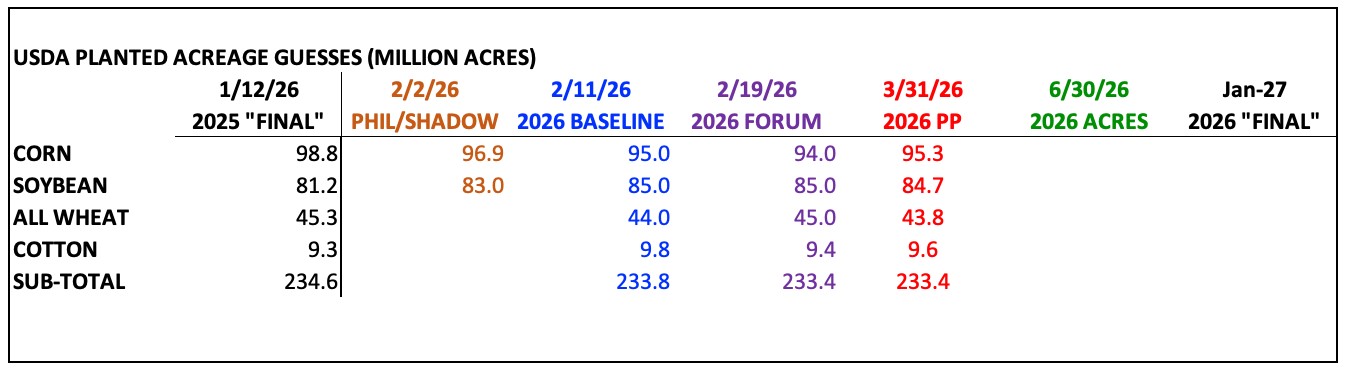
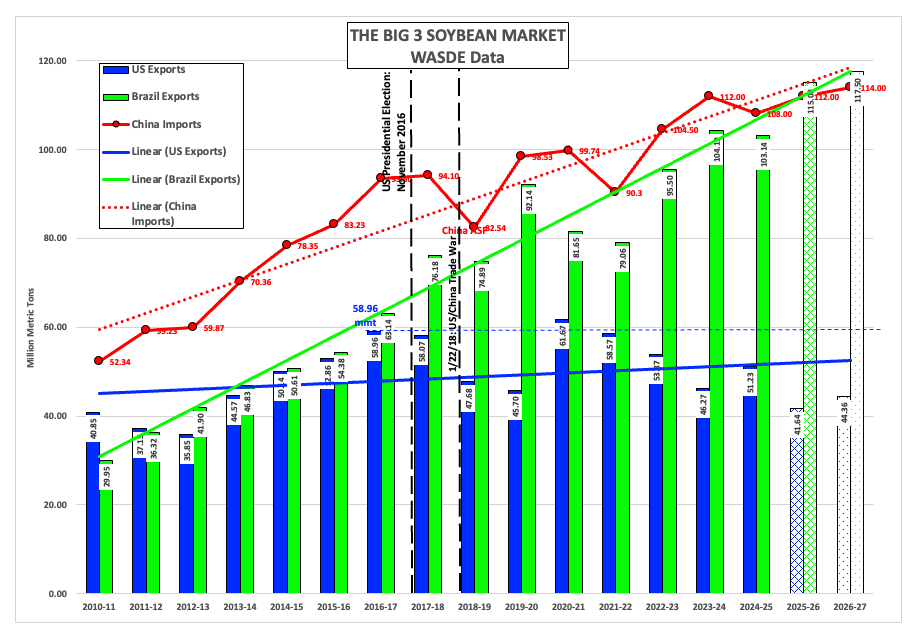
Soybeans: Over in soybeans, the comparison to last year’s acreage numbers has also shown consistency. Recall Punxsutawney Phil seeing his shadow last February indicated US soybean acres could increase roughly 2% year over year (while corn planted acres decrease by roughly 2%), putting the Groundhog Day guess at about 83.0 million acres. USDA’s Baseline and Annual Ag Forum guesses were even more dramatic, coming in at 85.0 ma, up 4.6% from last year’s “final” 81.2 ma. USDA then eased off the pedal a bit for its Prospective Plantings estimates, coming in at 84.7 ma. What happens today is anyone’s guess. And I know everyone has been making guesses because playing the game of Pin-The-Tail-On-The-Donkey is so very, very important. But I digress. In the back of my mind, I’ve stored what we saw with the 2026 edition of the Nov soybean/Dec corn futures spread from September 1 through February 28 that favored more corn acres year over year. And as we know, US producers like to plant corn, whether it makes money per unit or not. There is also the fact the US has taken itself out of the global soybean market, for the most part, with exports expected to be 64% less than Brazil’s.
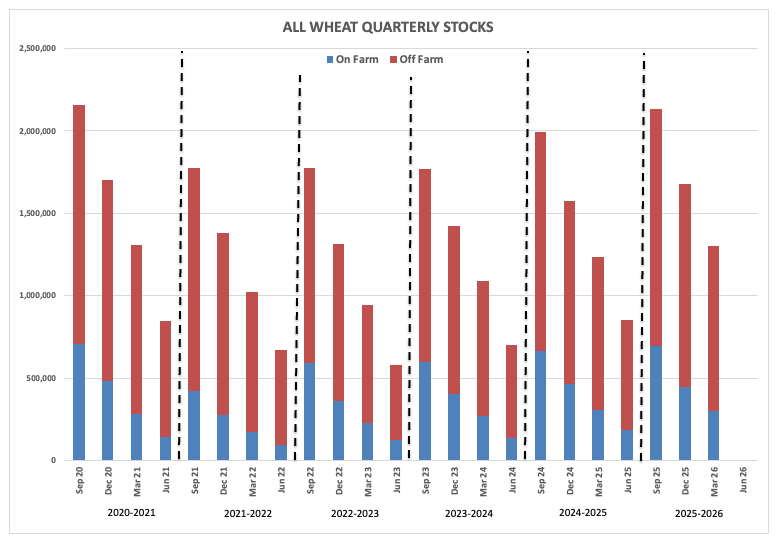
Wheat: Before we dig into the Beyond Meat and powdered mashed potatoes of the wheat sub-sector, I’ll mention all three markets were in the green to start this last day of June. Is it important? Not remotely. But it is easy to always say something bearish about wheat, and who knows how the day will end. So, there we go. Will Watson care much about USDA’s acreage update later Tuesday? Probably not, barring an extraordinary revision to what it has already said about planted area. Keep in mind US 2026 winter wheat crops are already being harvested, possibly reaching the midpoint heading into July, with spring wheat maturing at the same time. The issue with all three wheat markets is not the number of acres, but how much weather damage has been done to production, something we’ve been tracking in basis and futures spreads. Given this, there could be a smattering of interest in the all-wheat quarterly grain stocks number, the de facto ending stocks figure for the 2025-2026 marketing year. The June 1, 2025, figure was 850.5 million bushels, and the 2025-2026 quarterly stocks numbers ran higher through the first three quarters. The bottom line, as Barchart’s CARL told me, is the US is not running out of wheat.
On the date of publication, Darin Newsom did not have (either directly or indirectly) positions in any of the securities mentioned in this article. All information and data in this article is solely for informational purposes. For more information please view the Barchart Disclosure Policy here.
/An%20Intel%20sign%20out%20front%20of%20a%20corporate%20office%20by%20wolterke%20via%20Adobe%20Stock.jpeg)

/Micron%20Technology%20Inc_%20logo%20on%20building-by%20vzphotos%20vis%20iStock.jpg)
/United%20Parcel%20Service%2C%20Inc_%20logo%20on%20truck-by%20100pk%20via%20iStock.jpg)