Soybeans
Tuesday's Recap
March Soybean futures closed the day at a contract low of 978'6 Tuesday, lower by 7'2. Combined volume came in at a one month high of 410,287, with March seeing a heavy 142,638 done. Across all maturities, open interest rose by 1,338 (0.15%) to end the session with 915,659 outstanding. The March maturity rose 3.88%, or 1,338, to finish at 381,153.
Technicals
January soybean futures are making new contract lows this morning on a continued breakdown below the lower end of the month-long range. How much more downside is left is the million-dollar question. The RSI is at 34.74, so though we have seen heavy pressure in the last week it hasn't been enough to put the market into oversold territory. In the summer months we saw the RSI reach as low as about 21. With the market in uncharted territory, we need to revert to the continuous chart to find a potential support level. Based on that the next downside objective for the Bears comes in from 955-959.
Technical Levels of Importance
- Resistance: 1002 1/2-1006 1/2***, 1011 1/2-1013 3/4**, 1018-1024 3/4****
- Pivot: 986 1/4-987 1/4
- Support: 977 1/4-980 3/4*** 973 1/2**
Popular Options
The Jan 970 put saw the most changing hands with 6,422 contracts done. Options with the highest open interest are the March 1100 call with 17,258, and the March 980 put with 29,434.
Volatility Update
As measured by SVL, implied volatility ended the session higher, adding 0.34 to settle at a one week high of 16.37. The 30-day historical volatility finished dropping 0.0171% to 13.98%. The SVL Skew was slightly up with the 30-day gaining 0.26, finishing the session at a one week high of -0.13.
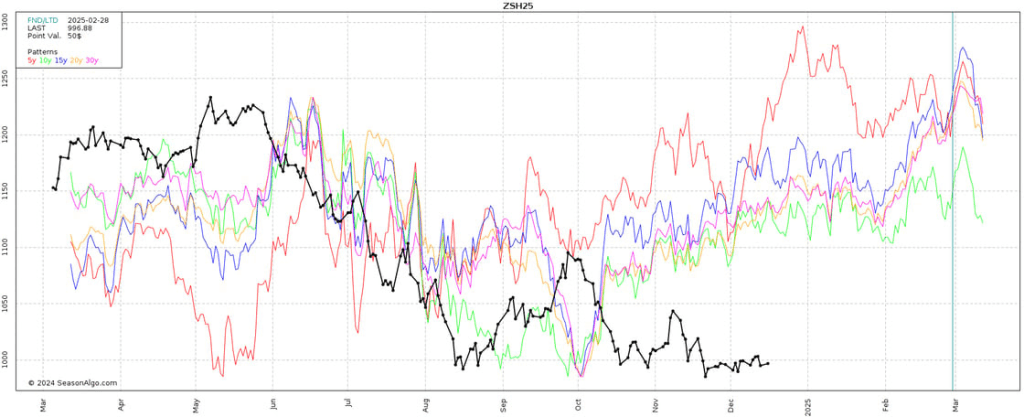
Seasonal Tendencies Update
(Updated on 12.16.24)
Below is a look at historical price averages for January soybean futures on a 5, 10, 15, 20, and 30 year time frames (Past performance is not necessarily indicative of future results). As with corn, December has been a historically friendlier month for soybeans. Keep in mind though that we've seen a lot of counter seasonal trends for beans throughout the year.
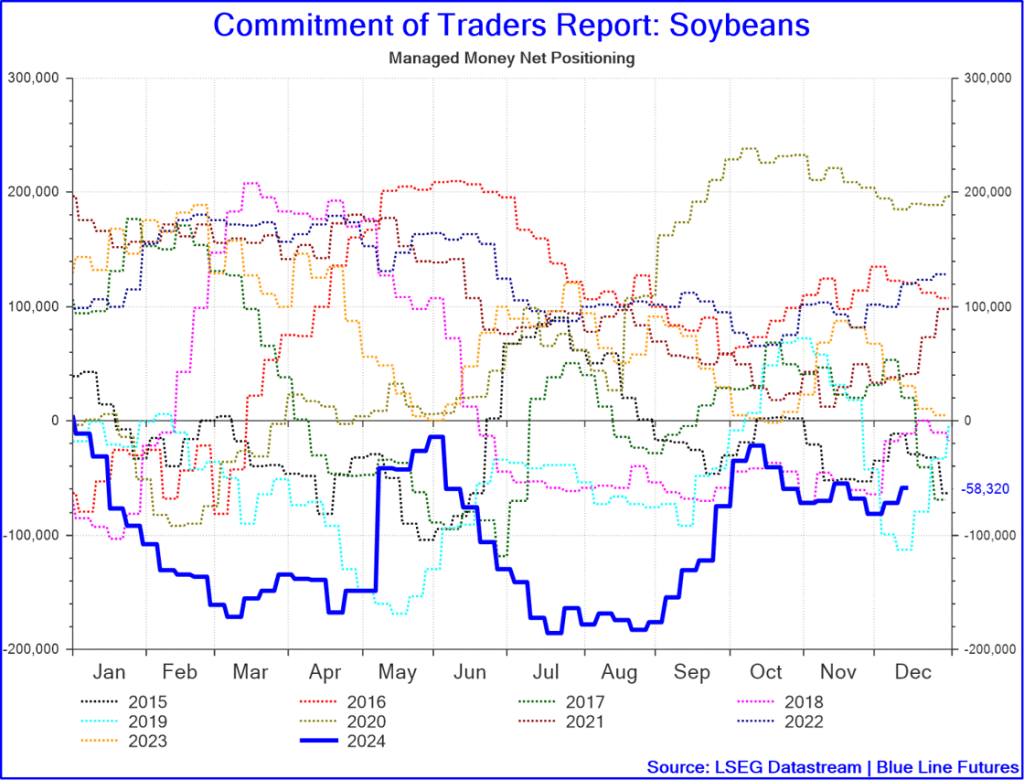
Commitment of Traders Update
(Updated on 12.16.24)
Friday's Commitment of Traders report showed funds trimmed their net short position slightly, bringing it to -58,320.
Ready to dig in?
Subscribe to our daily Grain Express for fresh insights into Soybeans, Wheat, and Corn. Get our expert technical analysis, proprietary trading levels, and actionable market bias delivered right to your inbox.
Sign Up for Free Futures Market Research – Bl
Futures trading involves substantial risk of loss and may not be suitable for all investors. Therefore, carefully consider whether such trading is suitable for you in light of your financial condition. Trading advice is based on information taken from trade and statistical services and other sources Blue Line Futures, LLC believes are reliable. We do not guarantee that such information is accurate or complete and it should not be relied upon as such. Trading advice reflects our good faith judgment at a specific time and is subject to change without notice. There is no guarantee that the advice we give will result in profitable trades. All trading decisions will be made by the account holder. Past performance is not necessarily indicative of future results.
Blue Line Futures is a member of NFA and is subject to NFA’s regulatory oversight and examinations. However, you should be aware that the NFA does not have regulatory oversight authority over underlying or spot virtual currency products or transactions or virtual currency exchanges, custodians or markets. Therefore, carefully consider whether such trading is suitable for you considering your financial condition.
With Cyber-attacks on the rise, attacking firms in the healthcare, financial, energy and other state and global sectors, Blue Line Futures wants you to be safe! Blue Line Futures will never contact you via a third party application. Blue Line Futures employees use only firm authorized email addresses and phone numbers. If you are contacted by any person and want to confirm identity please reach out to us at info@bluelinefutures.com or call us at 312- 278-0500
Performance Disclaimer
Hypothetical performance results have many inherent limitations, some of which are described below. No representation is being made that any account will or is likely to achieve profits or losses similar to those shown. In fact, there are frequently sharp differences between hypothetical performance results and the actual results subsequently achieved by any particular trading program.
One of the limitations of hypothetical performance results is that they are generally prepared with the benefit of hindsight. In addition, hypothetical trading does not involve financial risk, and no hypothetical trading record can completely account for the impact of financial risk in actual trading. For example, the ability to withstand losses or to adhere to a particular trading program in spite of trading losses are material points which can also adversely affect actual trading results. There are numerous other factors related to the markets in general or to the implementation of any specific trading program which cannot be fully accounted for in the preparation of hypothetical performance results and all of which can adversely affect actual trading results.
/AI%20(artificial%20intelligence)/AI%20microchip%20by%20DesignKingBD360%20via%20Shutterstock.jpg)


/A%20Palantir%20office%20building%20in%20Tokyo_%20Image%20by%20Hiroshi-Mori-Stock%20via%20Shutterstock_.jpg)