Soybeans
Friday’s Recap
For the fifth consecutive session, Soybean futures ended higher, with the Jan contract settling Friday at 1030’2, up by 4’0. Across all maturities, a heavy 498,465 contracts changed hands, with 253,189 traded in the Jan maturity. Total open interest lost 12,866, or 1.48%, to end the session with 853,777 outstanding. The Jan maturity fell 3.93% (12,866) to finish at 344,278.
Technicals
November soybeans saw a rip higher following Friday’s WASDE report that showed a bigger yield drop than expected. Some of that optimism was offset by headlines regarding rumors of Robert Lighthizer coming back as a US Trade Representative. After the close those rumors were dismissed, but we wouldn’t be surprised to see them come back around. Now, back to the technicals. The chart looks pretty constructive. Upside resistance remains intact from 1049-1052 1/2. If you’ve been long the market you may consider reducing exposure, especially if we fail against Friday’s high of 1044. Our pivot pocket from 1018-1024 3/4 will be an will be first support to keep an eye on this week. A failure there could set prices back towards $10.00.
Technical Levels of Importance
Resistance: 1049-1052 1/2***, 1083 3/4-1087 1/2****
Pivot: 1018-1024 3/4
Support: 1006-1008 3/4***, 995 3/4-1002 1/2***
Popular Options
The Jan 940 put saw the most changing hands with 10,423 contracts done on Friday. Option open interest is largest for the March 1100 calls at 15,318, and the Jan 940 puts at 22,253.
Volatility Update
Implied Volatility settled sharply down on Friday with SVL losing 1.8, to end at a one week low of 19.11. Down by 0.0750% to a twelve year low, historical volatility (as measured by the 30-day) ended at 13.51%. The SVL Skew closed slightly higher, up by 0.7 to finish the session at -0.27.
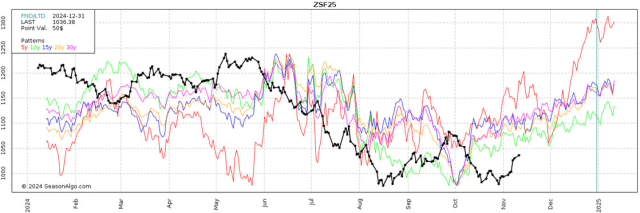
Seasonal Tendencies Update
Below is a look at historical price averages for January soybean futures on a 5, 10, 15, 20, and 30 year time frames (Past performance is not necessarily indicative of future results).
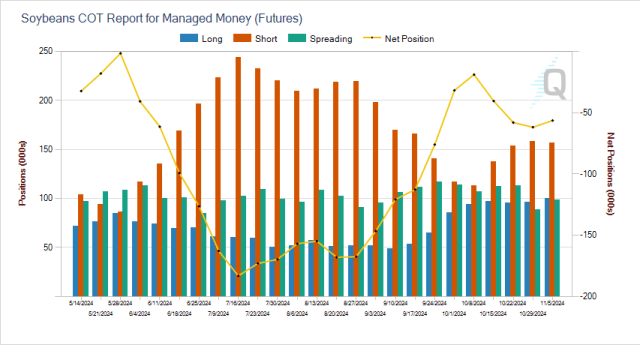
Commitment of Traders Update
Friday’s Commitment of Traders report showed Funds were net buyers of roughly 4.5k contracts, which puts them net short 56.4k contracts.
Wheat
Friday’s Recap
Friday’s Wheat market was mixed with the Dec contract adding 1’0 to 572’4. Total volume came in at a one month high of 237,928, with the Dec maturity seeing a heavy 112,145 change hands. Across all maturities, open interest fell 7,710 (1.72%), with Dec down by 18,132, or 9.80%, to 166,874.
Technicals
December wheat futures are the weak link in the early morning trade, treading on the edge of support. We’ve had that support pocket outlined as 557 1/2-560 1/2. A break and close here could trigger technical selling and open the door for a pullback to 544 1/4. To avoid a technical breakdown and a counter seasonal rally, the Bulls really need to see consecutive closes above 582 3/4-585 1/2.
Technical Levels of Importance
Resistance: 596-600, 615-617 1/2***, 629 1/2-634**
Pivot: 582 3/4-585 1/2
Support: 557 1/2-560 1/2***, 544 1/4***
Popular Options
Friday’s option trading centered around the Dec 570 calls with 3,068 traded and the Dec 570 puts with volume of 2,587. Option open interest is highest for the Dec 600 calls at 7,047, and the Dec 550 puts at 7,857.
Volatility Update
As measured by WVL, implied volatility closed the session down, losing 0.58 to end at a one month low of 27.16. Historical volatility (30-day) ended the day at 22.28%, lower by 0.0963%, to a twelve year low. The WVL Skew closed the session moderately lower, down by 0.39 to finish the day at a one month low of 4.76.
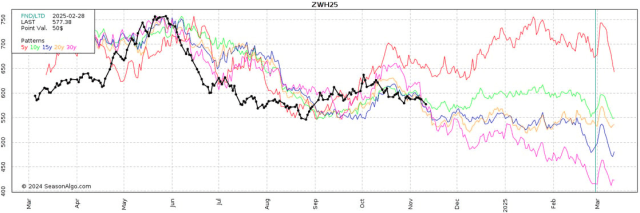
Seasonal Tendencies Update
Below is a look at historical price averages for March wheat futures on a 5, 10, 15, 20, and 30 year time frames (Past performance is not necessarily indicative of future results).
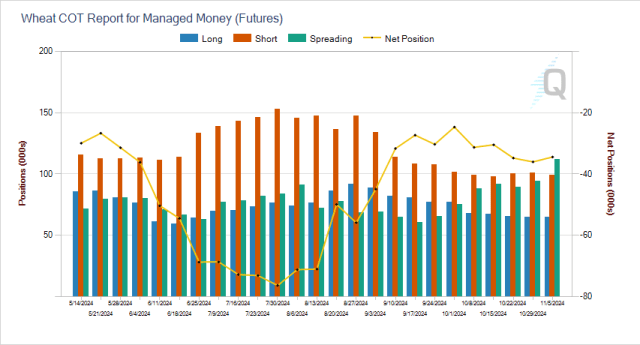
Commitment of Traders Update
Friday’s Commitment of Traders report showed another week of little change on the CoT. Funds were net buyers of about 1.5k contracts which puts them net short 34.5k.
Ready to dig in?
Subscribe to our daily Grain Express for fresh insights into Soybeans, Wheat, and Corn. Get our expert technical analysis, proprietary trading levels, and actionable market bias delivered right to your inbox.
Sign Up for Free Futures Market Research – Blue Line Futures
Futures trading involves substantial risk of loss and may not be suitable for all investors. Therefore, carefully consider whether such trading is suitable for you in light of your financial condition. Trading advice is based on information taken from trade and statistical services and other sources Blue Line Futures, LLC believes are reliable. We do not guarantee that such information is accurate or complete and it should not be relied upon as such. Trading advice reflects our good faith judgment at a specific time and is subject to change without notice. There is no guarantee that the advice we give will result in profitable trades. All trading decisions will be made by the account holder. Past performance is not necessarily indicative of future results.
Blue Line Futures is a member of NFA and is subject to NFA’s regulatory oversight and examinations. However, you should be aware that the NFA does not have regulatory oversight authority over underlying or spot virtual currency products or transactions or virtual currency exchanges, custodians or markets. Therefore, carefully consider whether such trading is suitable for you considering your financial condition.
With Cyber-attacks on the rise, attacking firms in the healthcare, financial, energy and other state and global sectors, Blue Line Futures wants you to be safe! Blue Line Futures will never contact you via a third party application. Blue Line Futures employees use only firm authorized email addresses and phone numbers. If you are contacted by any person and want to confirm identity please reach out to us at info@bluelinefutures.com or call us at 312- 278-0500
Performance Disclaimer
Hypothetical performance results have many inherent limitations, some of which are described below. No representation is being made that any account will or is likely to achieve profits or losses similar to those shown. In fact, there are frequently sharp differences between hypothetical performance results and the actual results subsequently achieved by any particular trading program.
One of the limitations of hypothetical performance results is that they are generally prepared with the benefit of hindsight. In addition, hypothetical trading does not involve financial risk, and no hypothetical trading record can completely account for the impact of financial risk in actual trading. For example, the ability to withstand losses or to adhere to a particular trading program in spite of trading losses are material points which can also adversely affect actual trading results. There are numerous other factors related to the markets in general or to the implementation of any specific trading program which cannot be fully accounted for in the preparation of hypothetical performance results and all of which can adversely affect actual trading results.
On the date of publication, Oliver Sloup did not have (either directly or indirectly) positions in any of the securities mentioned in this article. All information and data in this article is solely for informational purposes. For more information please view the Barchart Disclosure Policy here.

/AI%20(artificial%20intelligence)/AI%20microchip%20by%20DesignKingBD360%20via%20Shutterstock.jpg)


/A%20Palantir%20office%20building%20in%20Tokyo_%20Image%20by%20Hiroshi-Mori-Stock%20via%20Shutterstock_.jpg)