Corn
Thursday’s Recap
For the fourth consecutive session, Corn futures closed higher, with the Dec contract settling Thursday at 421’4, up 2’4. Across all maturities, a heavy 543,312 contracts were traded, with 287,987 done in the Dec maturity. Total open interest finished the session at a contract high of 1,666,751, gaining 3,419 (0.21%). Dec open interest decreased 10,488, or 1.40%, to 736,696.
Technicals
Corn futures came within a penny of the next upside target yesterday but ran out of gas. We will be keeping a close eye on our pivot pocket through today’s trade, that comes in from 413-416. A break and close back below this pocket could lead to additional pressure. I wouldn’t bank on that ahead of the weekend, but crazier things have happened.
Technical Levels of Importance
- Resistance: 425-426 1/2***
- Pivot:413-416
- Support: 406 1/2-408 1/2, 397-401 1/4*
Popular Options
The Dec 410 put saw the most changing hands with 12,533 contracts traded. Option open interest is largest for the Dec 430 calls at 33,738, and the Dec 400 puts at 36,131.
Volatility Update
As measured by CVL, implied volatility ended the session moderately lower, off by 0.52 to settle at a one week low of 19.47. Off 0.70%, historical volatility (as measured by the 30-day) settled at 17.90%. The CVL Skew was lower with the 30-day off 0.22, ending at 1.37.
Fundamental Notes
- Thursday’s Flash Sales
- 227,600 metric tons (8,960,213 bushels) of corn for delivery to Japan during the 2024/2025 marketing year.
- 165,000 metric tons (6,495,761 bushels) of corn for delivery to unknown destinations during the 2024/2025 marketing year.
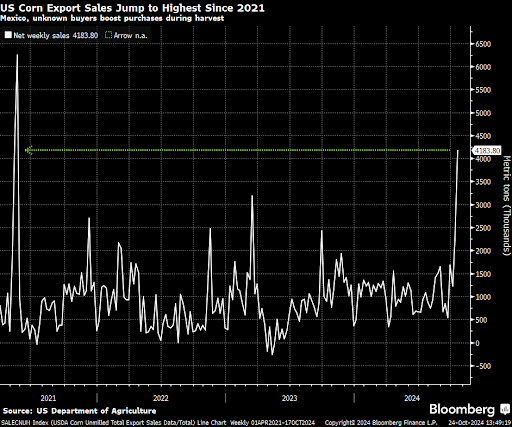
- Weekly Export Sales
- Net sales of 3,602,600 MT for 2024/2025 were up 62 percent from the previous week and up noticeably from the prior 4-week average. This was within the range of expectations (2,500,000-4,000,000 MT).
Soybeans
Thursday’s Recap
Jan Soybean futures settled at 1005’0 Thursday, even for the session. Across all maturities, volume came in at a contract high of 526,045, with Jan seeing a heavy 180,125 traded. Total open interest decreased 16,978, or 1.81%, to 920,904. Jan rose by 2,875 (0.93%), finishing at 311,676.
Technicals
Soybeans traded into our resistance pocket yesterday, which we have had outlined as 1010-1011 1/2 all week (the high was 1012 1/4). In yesterday’s report we wrote ” If you’re bearish, you may consider looking at resistance from 1010-1011 1/2 to get some exposure.”. The rejection there took prices back below $10.00 which has led to pressure right back to support from 982-984. If you took a bearish position against that resistance pocket, you may consider reducing/cutting that near support.
Technical Levels of Importance
- Resistance: 1010-1011 1/2*
- Pivot: 995 3/4-1001 1/4 982-984
- Support: 982-984, 972 3/4-975, 955-957 1/4**
Popular Options
The Nov 1000 put saw the most changing hands with 8,149 contracts done. Option open interest is highest for the Nov 1040 calls at 18,974, and the Nov 1040 puts at 19,355.
Volatility Update
Implied Volatility ended the session slightly lower with SVL down 0.19, to close at a one week low of 21.24. Losing 0.0521%, historical volatility (as measured by the 30-day) ended at 16.23%. The SVL Skew ended the day down, dropping 0.089 to close at 0.41, a one month low.
Fundamental Notes
- Thursday’s Flash Sale
- 198,000 metric tons (7,275,252 bushels) of soybeans for delivery to unknown destinations during the 2024/2025 marketing year.
- Weekly Export Sales
- Net sales of 2,151,700 MT for 2024/2025 were up 26 percent from the previous week and 47 percent from the prior 4-week average. This was within the range of expectations (1,400,000-2,400,000 MT).
Wheat
Thursday’s Recap
Dec Wheat futures settled at a one week high of 581’4 Thursday, up by 3’0. Combined volume was 95,230, with the Dec contract seeing 49,883 change hands. Across all maturities, open interest shed 1,525, or 0.38%, with Dec dropping 2,990 (1.48%) to 198,928.
Technicals
In yesterday’s report we talked about it being “go time” for the wheat market with prices against our pivot pocket from 582 3/4-584 1/4. Meaning that it’s do or die, a failure there would mark another lower high which keeps the door open for another lower low and a retest of support from 560 1/2-565 3/4. The Bulls need to achieve consecutive closes above that pivot pocket to get technical traders excited about a run back towards $6.00 and beyond.
Technical Levels of Importance
- Resistance: 596-600, 615-617 1/2, 629 1/2-634
- Pivot: 582 3/4-584 1/4
- Support: 560 1/2-565 3/4, 544 1/4***
Popular Options
Option volumes were greatest for the March 700 call (1,334) and the Nov 575 put (1,223). For Dec options, the 600 calls were the most active with 449 changing hands, and the high volume put was the 560 strike with 263 contracts done. Option open interest is greatest for the Dec 600 calls at 7,676, and the Dec 550 puts at 6,585.
Volatility Update
As measured by WVL, implied volatility finished the day slightly down, dropping by 0.093 to close the session at 30.51. The 30-day historical volatility finished the session losing 1.44% to a one month low of 24.12%. The WVL Skew was moderately up with the 30-day gaining 0.42, finishing the day at a one week high of 6.28.
Fundamental Notes
- Weekly Export Sales
- Net sales of 532,900 MT for 2024/2025 were up 6 percent from the previous week and 38 percent from the prior 4-week average. This was within the range of expectations (350,000-650,000 MT).
Ready to dig in?
Subscribe to our daily Grain Express for fresh insights into Soybeans, Wheat, and Corn. Get our expert technical analysis, proprietary trading levels, and actionable market bias delivered right to your inbox.
Sign Up for Free Futures Market Research – Blue Line Futures
Futures trading involves substantial risk of loss and may not be suitable for all investors. Therefore, carefully consider whether such trading is suitable for you in light of your financial condition. Trading advice is based on information taken from trade and statistical services and other sources Blue Line Futures, LLC believes are reliable. We do not guarantee that such information is accurate or complete and it should not be relied upon as such. Trading advice reflects our good faith judgment at a specific time and is subject to change without notice. There is no guarantee that the advice we give will result in profitable trades. All trading decisions will be made by the account holder. Past performance is not necessarily indicative of future results.
Blue Line Futures is a member of NFA and is subject to NFA’s regulatory oversight and examinations. However, you should be aware that the NFA does not have regulatory oversight authority over underlying or spot virtual currency products or transactions or virtual currency exchanges, custodians or markets. Therefore, carefully consider whether such trading is suitable for you considering your financial condition.
With Cyber-attacks on the rise, attacking firms in the healthcare, financial, energy and other state and global sectors, Blue Line Futures wants you to be safe! Blue Line Futures will never contact you via a third party application. Blue Line Futures employees use only firm authorized email addresses and phone numbers. If you are contacted by any person and want to confirm identity please reach out to us at info@bluelinefutures.com or call us at 312- 278-0500
Performance Disclaimer
Hypothetical performance results have many inherent limitations, some of which are described below. No representation is being made that any account will or is likely to achieve profits or losses similar to those shown. In fact, there are frequently sharp differences between hypothetical performance results and the actual results subsequently achieved by any particular trading program.
One of the limitations of hypothetical performance results is that they are generally prepared with the benefit of hindsight. In addition, hypothetical trading does not involve financial risk, and no hypothetical trading record can completely account for the impact of financial risk in actual trading. For example, the ability to withstand losses or to adhere to a particular trading program in spite of trading losses are material points which can also adversely affect actual trading results. There are numerous other factors related to the markets in general or to the implementation of any specific trading program which cannot be fully accounted for in the preparation of hypothetical performance results and all of which can adversely affect actual trading results.
On the date of publication, Oliver Sloup did not have (either directly or indirectly) positions in any of the securities mentioned in this article. All information and data in this article is solely for informational purposes. For more information please view the Barchart Disclosure Policy here.


/Cisco%20Systems%2C%20Inc_%20HQ-by%20Sundry%20Photography%20via%20iStock.jpg)

