Corn
Tuesday's Recap
Tuesday's Corn market was higher with the Dec contract up 7'0 (1.71%), to 416'4, a one week high. Overall volume was a heavy 515,788, with Dec seeing 267,224 traded. Across all maturities, open interest finished the day at a one month high of 1,643,304, adding 24,814 (1.53%). Dec open interest dropped 2,674, or 0.36%, to 747,710.
Technicals
Corn futures officially reached the first upside objective for Bulls, which we've outlined over the last week as 413-416. Can the market continue to grind higher and retest the top end of the range from the start of the month? Sure. But we wouldn't be surprised to see the market catch it's breath here. With that in mind, if you've been long from our support pocket near $4.00, you may consider reducing exposure. If you're bearish or looking for a trade setup, the short side may be worth a look on a short-term basis. Volatility is low right now which we feel makes options a good tool to use to hedge futures positions. Unfortunately, the regulator overlords don't like when blanket recommendations are blasted out (and rightfully so, everyone has a different risk profile and objective), so if you have questions on strategies our trade desk is always available to help clients: 312-278-0500.
Technical Levels of Importance
Resistance: 425-426 1/2***
Pivot:413-416
Support: 406 1/2-408 1/2, 397-401 1/4*
Popular Options
Option volumes were highest for the July 500 call (31,146) and the Nov 405 put (6,903). In Dec options, the highest volume call was in the 425 strike with 4,699 done, and the 410 put leads with volume of 3,777. Options with the highest open interest are the Dec 430 call with 32,183, and the Dec 400 put with 36,233.
Volatility Update
Implied Volatility finished the day moderately higher with CVL gaining 0.22, to close at a one week high of 20.49. Historical volatility (30-day) ended the day at 18.55%, adding 0.65%, to a one week high. The CVL Skew was sharply up with the 30-day higher by 0.42, finishing the session at a one week high of 1.54.
Seasonal Tendency Update
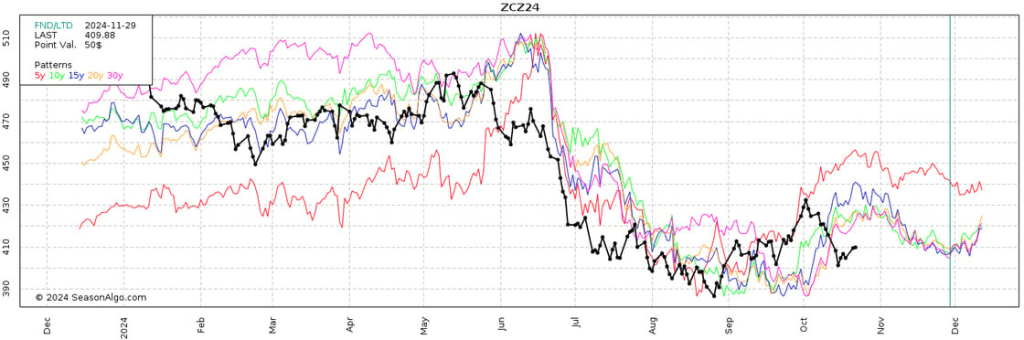
Below is a chart of the December 2024 corn contract (black line) compared to price averages over the last 5, 10, 15, 20, and 30 years.
*Past performance is not necessarily indicative of future results.
Wheat
Tuesday's Recap
Tuesday's Wheat market was higher with the Dec contract up 3'6 to 576'0. Across all maturities, a light 83,898 contracts changed hands, with 49,868 traded in the Dec maturity. Combined open interest finished at a one month high of 410,803, up by 4,414, or 1.09%. Dec open interest gained 846 (0.42%), to 203,844.
Technicals
December wheat futures probed lower yesterday but were able to defend the upper end of our support pocket at 565 3/4, the lower end of that comes in at 560 1/2. We've been leaning a little more on the bearish side since the break below trendline support about two weeks ago, but 560 1/2-565 3/4 would be a spot to start looking long if you're Bullish. If you've been playing the bearish side, you may consider reducing exposure. If that pocket does fail it could accelerate the selling pressure. The wheat market can be pretty unforgiving, so be sure to manage your risk appropriately. If you'd like to discuss different strategies to gain limited risk exposure, our trade desk is here to help: 312-278-0500.
Technical Levels of Importance
Resistance: 596-600, 615-617 1/2, 629 1/2-634
Pivot: 582 3/4-584 1/4
Support: 560 1/2-565 3/4, 544 1/4***
Popular Options
The Dec 590 put saw the most changing hands with 1,509 contracts done. Options with the highest open interest are the Dec 600 call with 7,714, and the Dec 550 put with 6,417.
Volatility Update
Implied Volatility finished the session slightly higher with WVL up 0.17, to close at a one week high of 30.50. Lower by 0.0584%, historical volatility (as measured by the 30-day) finished the day at 25.52%. The WVL Skew ended higher, up by 0.33 to close the day at 6.03, a one week high.
Seasonal Tendency Update
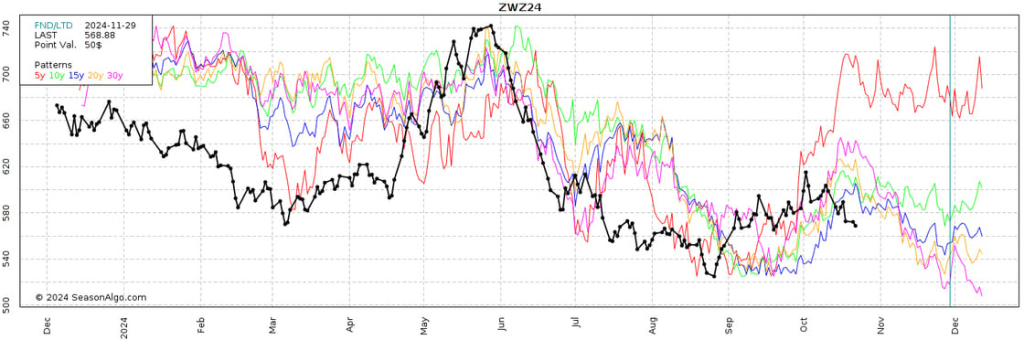
Below is a chart of the 2024 December wheat contract (black line) compared to price averages over the last 5, 10, 15, 20, and 30 years.
*Past performance is not necessarily indicative of future results.
Ready to dig in?
Subscribe to our daily Grain Express for fresh insights into Soybeans, Wheat, and Corn. Get our expert technical analysis, proprietary trading levels, and actionable market bias delivered right to your inbox.
Sign Up for Free Futures Market Research – Blue Line Futures
Futures trading involves substantial risk of loss and may not be suitable for all investors. Therefore, carefully consider whether such trading is suitable for you in light of your financial condition. Trading advice is based on information taken from trade and statistical services and other sources Blue Line Futures, LLC believes are reliable. We do not guarantee that such information is accurate or complete and it should not be relied upon as such. Trading advice reflects our good faith judgment at a specific time and is subject to change without notice. There is no guarantee that the advice we give will result in profitable trades. All trading decisions will be made by the account holder. Past performance is not necessarily indicative of future results.
Blue Line Futures is a member of NFA and is subject to NFA’s regulatory oversight and examinations. However, you should be aware that the NFA does not have regulatory oversight authority over underlying or spot virtual currency products or transactions or virtual currency exchanges, custodians or markets. Therefore, carefully consider whether such trading is suitable for you considering your financial condition.
With Cyber-attacks on the rise, attacking firms in the healthcare, financial, energy and other state and global sectors, Blue Line Futures wants you to be safe! Blue Line Futures will never contact you via a third party application. Blue Line Futures employees use only firm authorized email addresses and phone numbers. If you are contacted by any person and want to confirm identity please reach out to us at info@bluelinefutures.com or call us at 312- 278-0500
Performance Disclaimer
Hypothetical performance results have many inherent limitations, some of which are described below. No representation is being made that any account will or is likely to achieve profits or losses similar to those shown. In fact, there are frequently sharp differences between hypothetical performance results and the actual results subsequently achieved by any particular trading program.
One of the limitations of hypothetical performance results is that they are generally prepared with the benefit of hindsight. In addition, hypothetical trading does not involve financial risk, and no hypothetical trading record can completely account for the impact of financial risk in actual trading. For example, the ability to withstand losses or to adhere to a particular trading program in spite of trading losses are material points which can also adversely affect actual trading results. There are numerous other factors related to the markets in general or to the implementation of any specific trading program which cannot be fully accounted for in the preparation of hypothetical performance results and all of which can adversely affect actual trading results.
On the date of publication, Oliver Sloup did not have (either directly or indirectly) positions in any of the securities mentioned in this article. All information and data in this article is solely for informational purposes. For more information please view the Barchart Disclosure Policy here.

/AI%20(artificial%20intelligence)/AI%20microchip%20by%20DesignKingBD360%20via%20Shutterstock.jpg)


