/Close-up%20shot%20of%20Rivian%20R1T_%20Image%20by%20Trong%20Nguyen%20via%20%20Shutterstock_.jpg)
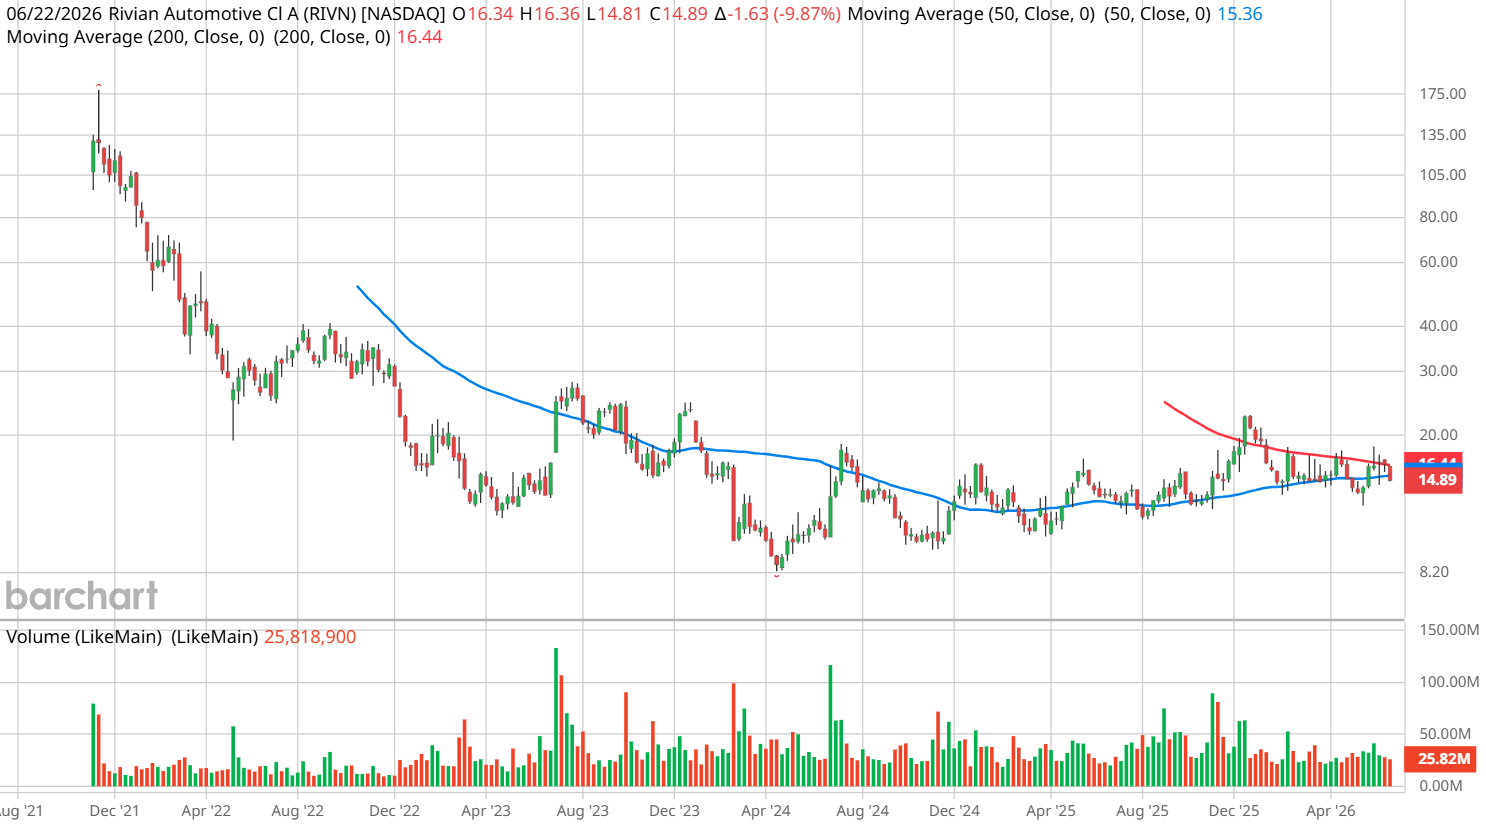
Rivian Automotive (RIVN) is a difficult nut to crack — and it’s not just a rhetorical sentiment but a mathematical one. Sure, the surface-level stats don’t look appealing for RIVN stock whatsoever. Since the start of the year, shares of the electric vehicle manufacturer have lost more than 24%. Barchart’s Technical Opinion indicator rates the equity as a 32% Weak Sell.
Fundamentally, the picture appears to worsen. We’re talking about an enterprise that burns cash in a brutally competitive space with multiple simultaneous strategic pivots. Beyond the immediate financial concerns, Rivian suffers from an unclear path to profitability. So, it’s not terribly surprising that among conservative investors, RIVN stock has lost much credibility.
For the financial publication sector, it’s difficult to determine where the EV maker is headed. Analyzing deterministic systems — such as events that happened in the past — is relatively straightforward. Evidence is additive as the underlying volume serves to narrow the probability space of the event in question. However, in non-deterministic systems like the equities market, evidence is multiplicative.
Let’s examine why. In a deterministic system, accumulated evidence points toward certainty because there's a certain thing to accumulate toward. In a non-deterministic system, “evidence” is really an assumption — and each assumption is a necessary condition that must hold simultaneously for a specific future outcome to occur.
That’s a problem for RIVN stock because the confidence level of its bullish investment thesis is admittedly weak; essentially, investors are saying that the changes seen in Rivian (such as mass layoffs) are ultimately positive for the company and that these changes will be eventually recognized as positive, leading to a higher rerating for RIVN.
If we were to assign a very generous 70% confidence level to each of these points, the compounded probability that these factors will materialize simultaneously as predicted is only 49% (0.7 x 0.7 = 0.49) — slightly worse odds than a coin toss. Therefore, it’s incredibly difficult to use fundamental analysis to make sense of RIVN stock.
Getting Your Feet Wet with RIVN Stock
Of course, 49% confidence doesn’t sound appetizing but if we’re being honest, the real statistical picture is likely worse. Given the enormous challenges facing Rivian, 70% confidence in just the strategic vision of management is probably excessive. Further, RIVN stock is down roughly 89% in the trailing five years. It would seem that the compounded probability of the bullish investment thesis is more toward 25% or lower.
However, the poor investment outlook doesn’t necessarily mean that near-term options traders can’t potentially exploit RIVN stock for quick profits. While we can never produce absolute evidence for non-deterministic systems, we can take a page out of Amazon’s (AMZN) playbook to help figure out where RIVN may land over a given time period.
As you know, Amazon engages in extensive datamining to make its inventory management process more efficient. Through its rigorous analytics, it can predict what consumers will buy, ensuring rational inventory levels that ultimately help cut down on shipping costs. This predictability is largely tied to correlated relationships, such as cold weather cycles and umbrella sales.
We can use a similar principle with RIVN stock by observing various conditions and how RIVN responds to them. Moreover, if the response to a specific signal or circumstance leads consistently to better performance relative to a random baseline, this observation may offer an edge to the speculator. And because any edge is likely to be modest over a short time period, we can use options to provide enhanced leverage.
What’s fascinating is that when we observe RIVN stock across various sentiment cycles, we can observe variances in future outcomes. For example, if we were to hold Rivian stock randomly for a 10-week period, statistically, we are more likely to suffer a slightly negative bias. In contrast, when RIVN is coming off a bearish cycle, it tends to generate a positive return over the same 10-week period.
Is It Worth the Squeeze?
How significant is this variance, you might be wondering? Holding RIVN stock randomly for 10 weeks results in a forward distribution between $14 and $15.40 (assuming a starting price of $14.89), with probability density peaking at around $14.80. Again, we’re looking at a negative bias if we traded Rivian randomly.
However, in the last 10 weeks, RIVN stock printed only four up weeks, leading to an overall downward slope. Under this specific signal, the forward distribution comes out to between $14 and $17.20, with probability density peaking at around $15.30. These are median values and there’s no logical necessity that RIVN must trade along these observed trends.
Still, there does appear to be a quantitative difference between how RIVN stock trades randomly versus how it trades following a bearish momentum cycle. Subsequently, those who want to place a bet on this inference may consider the 15/16 bull call spread expiring Aug. 21.
Basically, the justification is that the $16 strike price is observed to be a realistic target (since the expected distributional endpoint is $17.20). Also, the $15.44 breakeven price is very close to the forecasted peak probability density of RIVN stock relative to the bearish condition I referenced above.
Whether the trade is ultimately worthwhile to you depends on your personal risk tolerance. Inferences are always subject to the black swan risk so I can’t guarantee that the expected outcome will play out. However, at $44 per spread, it is a nominally cheap way to get exposure to RIVN stock.
On the date of publication, Josh Enomoto did not have (either directly or indirectly) positions in any of the securities mentioned in this article. All information and data in this article is solely for informational purposes. For more information please view the Barchart Disclosure Policy here.
/Micron%20Technology%20Inc_%20logo%20on%20building-by%20vzphotos%20vis%20iStock.jpg)


/Lululemon%20Athletica%20inc_%20storefront%20by-%20Robert%20Way%20via%20iStock.jpg)
/Semiconductor%20chip%20by%20Mykola%20Pokhodzhay%20via%20iStock.jpg)