Dual Edge Research publishes two powerful newsletters that work great individually — and even better together. The Bull Strangle Newsletter focuses on stocks and options, combining stock ownership with premium-selling strategies to generate consistent income and market-beating returns. The Smart Spreads Newsletter specializes in seasonal commodity futures spreads, offering a diversified approach with low correlation to equities. Together, they deliver a complete investment perspective — one focused on income, the other on diversification — all under one simple subscription.
Introduction
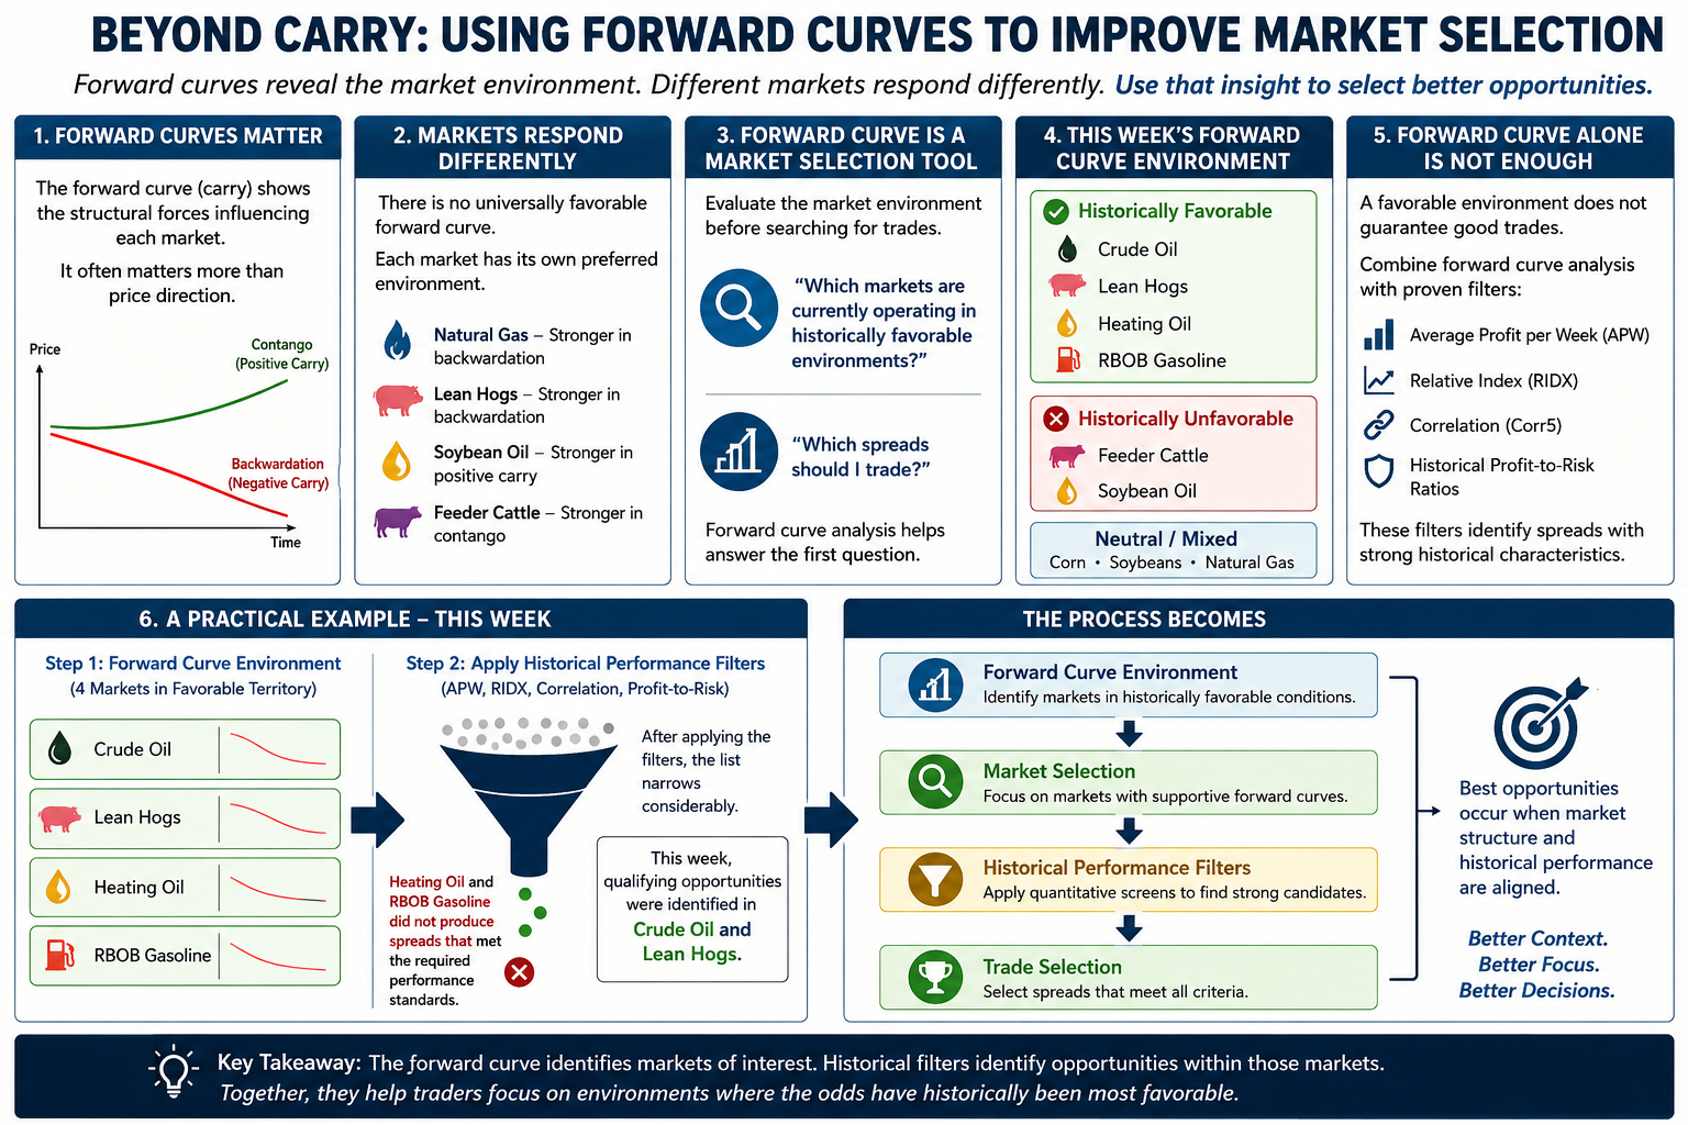
In the first two articles of this series, we explored how to read forward curves and why carry often matters more than outright price direction in spread trading. Understanding the forward curve helps traders see forces that are often invisible when focusing solely on seasonal patterns or price forecasts. But understanding carry is only the beginning. The more important question is how traders can use forward curves to make better decisions. Recent research conducted during the development of Trading Commodity Spreads revealed an important insight: forward curves are not just useful for evaluating individual spreads. They can also be used to evaluate the environment in which an entire market is operating. That distinction may be one of the most valuable applications of forward curve analysis.
Not All Markets Respond the Same Way
Many traders assume that a favorable carry environment should produce similar results across different commodity markets. The research suggests otherwise. A database containing more than 31,000 historical spread trades was analyzed using forward-curve data and several performance filters. The objective was simple: to determine whether certain forward-curve environments consistently produced better spread performance.
The answer was yes—but with an important twist. Different markets responded differently to the same forward curve conditions. For example, Natural Gas historically produced some of its strongest spread performance during periods of significant backwardation. As the curve became more negative, average profits and win rates improved dramatically. Lean Hogs displayed a similar tendency.
However, Soybean Oil showed nearly the opposite behavior. Historically, spreads performed better when the market exhibited positive carry and weaker results when backwardation became extreme. Feeder Cattle produced yet another pattern, often generating stronger results during periods of significant contango. The conclusion was clear:
- There is no universally favorable forward curve. Instead, each market appears to have its own preferred forward curve environment.
Forward Curve as a Market Selection Tool
This discovery changes how traders can think about carry. Traditionally, traders evaluate a spread after it has already been identified. The forward curve becomes one more characteristic of the trade. The research suggests a different approach.
Because every spread within a market shares the same forward curve environment at a given point in time, the forward curve can be evaluated before the trade search even begins. In other words, traders can ask:
- "Which markets are currently operating in historically favorable environments?"
before asking:
- "Which spreads should I trade?"
This transforms forward curve analysis from a trade-selection tool into a market-selection tool.
This Week's Forward Curve Environment
Applying this framework to current market conditions produces several interesting observations. Historically favorable environments currently exist in:
- Crude Oil
- Lean Hogs
- Heating Oil
- RBOB Gasoline
Historically unfavorable environments currently exist in:
- Feeder Cattle
- Soybean Oil
Other markets, such as Corn, Soybeans, and Natural Gas, currently occupy more neutral territory. This does not mean favorable markets should automatically be traded or unfavorable markets should automatically be avoided. It simply provides context. A trader seeking opportunities may wish to focus additional attention on markets currently operating in historically supportive environments.
Why Forward Curve Alone Is Not Enough
This is where many traders make a critical mistake. Forward curve analysis identifies favorable market conditions. It does not identify favorable trades. A market may exhibit an attractive forward curve while containing few spreads with desirable seasonal characteristics. Conversely, an unfavorable market environment may still contain exceptional opportunities. This is why forward curve analysis should be combined with additional filters. The Smart Spreads framework uses metrics such as:
- Average Profit per Week (APW)
- Relative Index (RIDX)
- Correlation (Corr5)
- Historical Profit-to-Risk Ratios
These filters help identify spreads with strong historical characteristics. Forward curve analysis then provides an additional layer of context. Rather than replacing the existing filters, it enhances them.
A Practical Example
Applying this framework to current market conditions produced several interesting observations. Based on historical forward curve behavior, Crude Oil, Lean Hogs, Heating Oil, and RBOB Gasoline currently appear to be operating in favorable environments:
- At first glance, a trader might assume that all four deserve equal consideration. However, forward curve analysis is only the first step in the process. The next step is applying the historical performance filters developed through the Smart Spreads research. Metrics such as Average Profit per Week (APW), Relative Index (RIDX), correlation, and historical risk-adjusted performance help identify spreads that have demonstrated consistent historical behavior.
- After applying those filters, the list narrowed considerably. This week, qualifying opportunities were identified in Crude Oil and Lean Hogs, while Heating Oil and RBOB Gasoline failed to produce spreads that met the required performance standards. The process becomes:
Forward Curve Environment
↓
Market Selection
↓
Historical Performance Filters
↓
Trade Selection
This distinction is important. The forward curve helps identify markets where conditions may be favorable, but it does not guarantee the existence of attractive trading opportunities. The historical filters perform that final screening process. The most attractive opportunities often occur when both factors align: a market operating in a historically favorable forward-curve environment and a spread that meets historical performance requirements.
Want to build a more complete trading toolkit?
The Bull Strangle Newsletter focuses on stocks and options, combining stock ownership with disciplined option-selling techniques designed to generate consistent income while managing risk.
The Smart Spreads Newsletter focuses on seasonal commodity spreads, a historically proven approach that seeks opportunities across agricultural, energy, metal, and financial futures markets.
Each strategy is designed to stand on its own, but together they provide a diversified approach that can perform across a wide range of market environments. For traders looking to deepen their education, The Bull Strangle Strategy and Trading Commodity Spreads, both available on Amazon.
Visit BullStrangle.com to subscribe for just $1 for the first month.
For a video overview of the Bull Strangle Newsletter
For a video overview of the Smart Spreads Newsletter
Darren Carlat
Dual Edge Research
(214) 636-3133
DualEdgeResearch@gamil.com
Disclaimer
This information is for informational purposes only and should not be considered as investment advice. Past performance is not indicative of future results, and all investments carry inherent risk. Consult with a financial advisor before making any investment decisions.

/A%20close-up%20of%20a%20SpaceX%20sign%20by%20Sundry%20Photography%20via%20Adobe%20Stock.jpeg)

/AI%20(artificial%20intelligence)/AI%20chip%20by%203Dsss%20via%20Shutterstock.jpg)
