
- The noncommercial side of the soybean market recently moved to a record large net-short futures position.
- While the effect on the market has been bearish for price, it also sets the stage for a potential short covering rally if the May-July futures spread stays bullish.
- In the end, though, it won't be enough to change the fate of the US soybean market that still finds itself shoved to the sidelines due to a social media-driven trade war with the world's largest buyer.
There is a lot of chatter about the US soybean market these days (Note I left out the word ‘mindless’), and rightfully so,. February is a key month for soybeans as it marks the end of the first half of the US marketing year (though ‘marketing year’ is a concept that needs to eventually go away[i]), US export shipments are roughly 70% completed, and China’s weeklong New Year holiday takes place. This year, given what we’ve seen in the market the last number of months, the February Goldman Roll is set to begin Wednesday, February 7 and last through Tuesday February 13. With all this going on, we can boil the soybean market down to its essence with three charts. Here’s how.
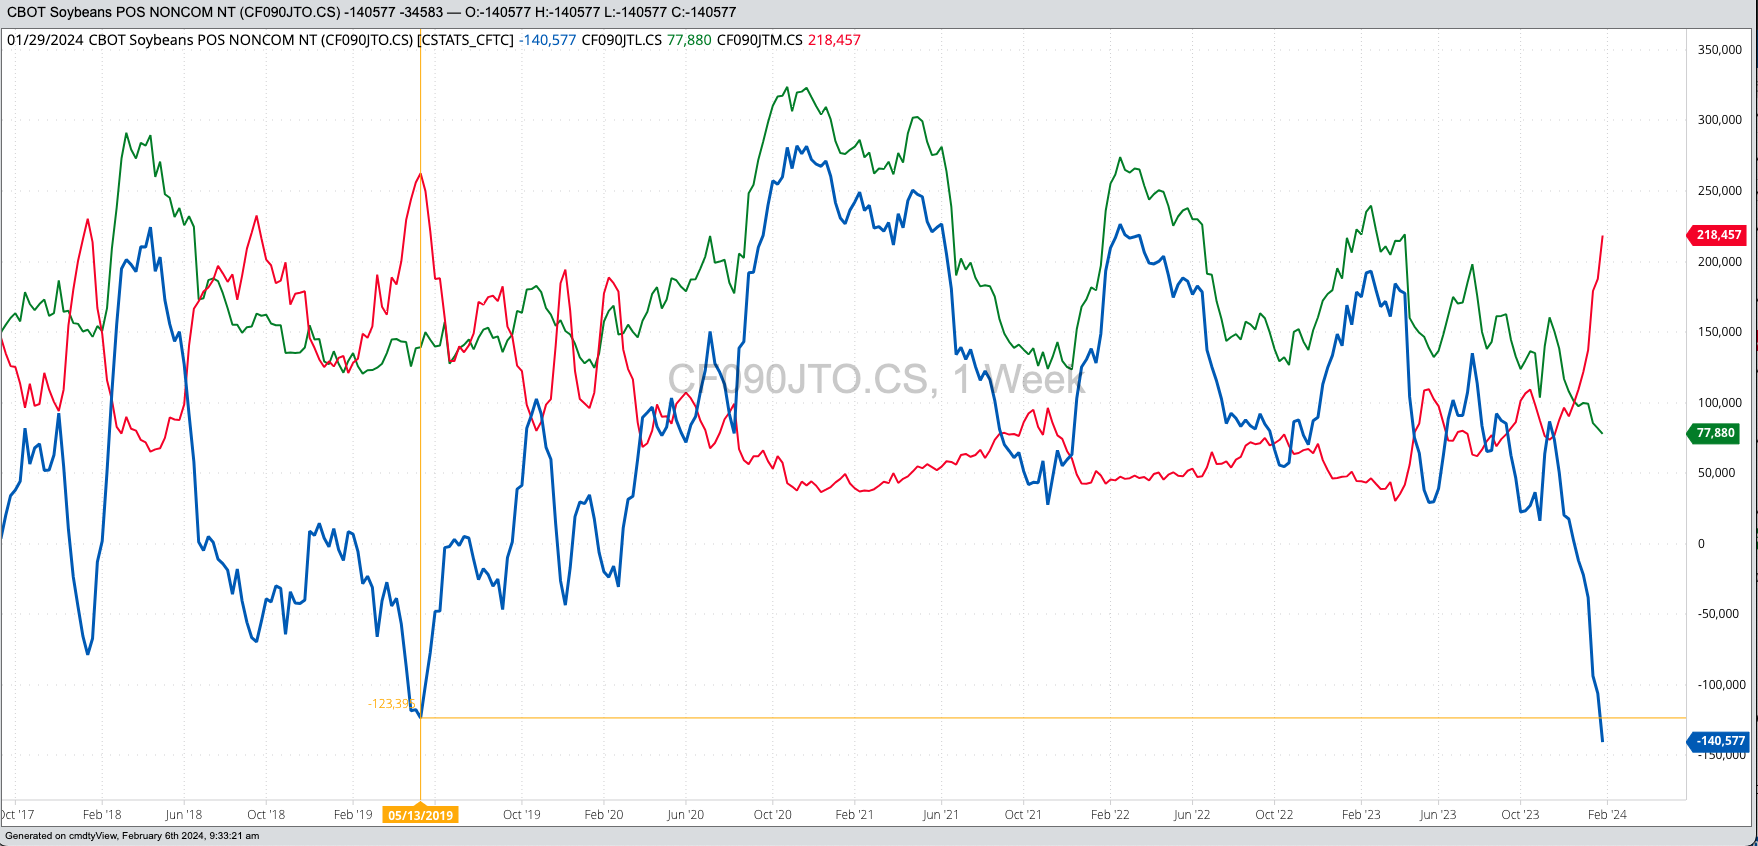
Newton’s First Rule of Motion Applied to markets that tells us, “A trending market will stay in that trend until acted upon by an outside force, with that outside force usually investment money[ii]”. Given this, let’s take a look at the latest CFTC Commitments of Traders report (legacy, futures only) chart for noncommercial positions as of Tuesday, January 30. Of all the CoT numbers and charts that came out last Friday, this was the one I was looking forward to the most, and it did not disappoint. Recall from Tuesday-to-Tuesday, March soybean futures (ZSH24) lost as much as 51.75 cents before closing 20.75 cents lower for the week. This told us funds had continued to add to their net-short futures position, and they had. Friday’s report showed a new record large of 140,577 contracts with shorts of 218,457 contracts the largest since the week of May 27, 2019. While this activity has pushed the market down, with March futures falling $2.31 from the November 15 high through this past Monday’s low, it also opens the door to a short covering rally. But why would funds start covering this position?
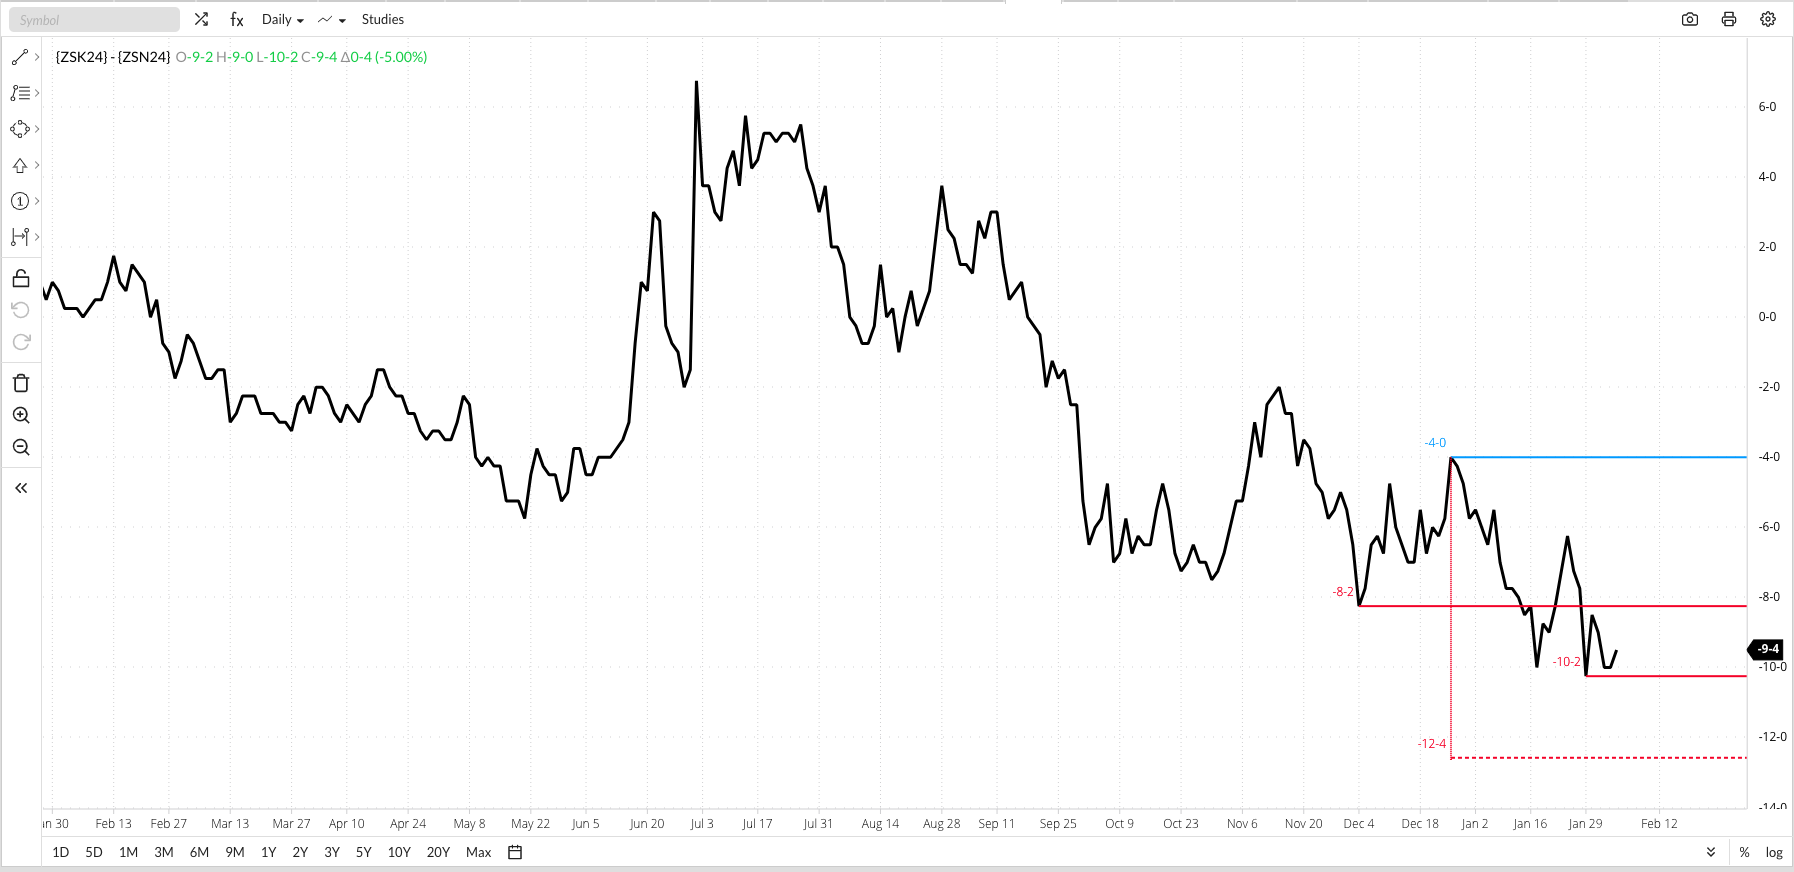
I recently wrote about how the most bullish factor in the soybean market (the Grains sector in general) was the noncommercial net-short futures position. Newsom’s Market Rule #6 tells us fundamentals win in the end, so we have to ask ourselves if soybean market fundamentals warrant a record large net-short futures position held by funds? National average basis is neutral at best in early February, with the first weekly calculation coming in at 53.75 cents under March futures as compared to the previous 5-year average weekly close for the week of 46.25 cents under and the previous 5-year low weekly close of 89.75 cents under March. The fact basis is neutral, and generally in its seasonal sideways trend, tells us there is no immediate concern over supply in relation to demand. In fact, last Friday’s National Cash Index (ZSPAUS.CM) came in near $11.35, correlating to an available stocks-to-use of 10.5%. This continues to be the largest as/u, based on monthly closes, since November 2020. But what about further out? The May-July futures spread closed Monday at a carry of 9.5 cents after flirting with its low daily close of 10.25 cents carry. The fact the spread has not extended its downtrend, at least not yet, and continues to cover a bullish level of calculated full commercial carry (less than 33%) tells us merchandisers may be looking for a later than normal seasonal increase in export demand.
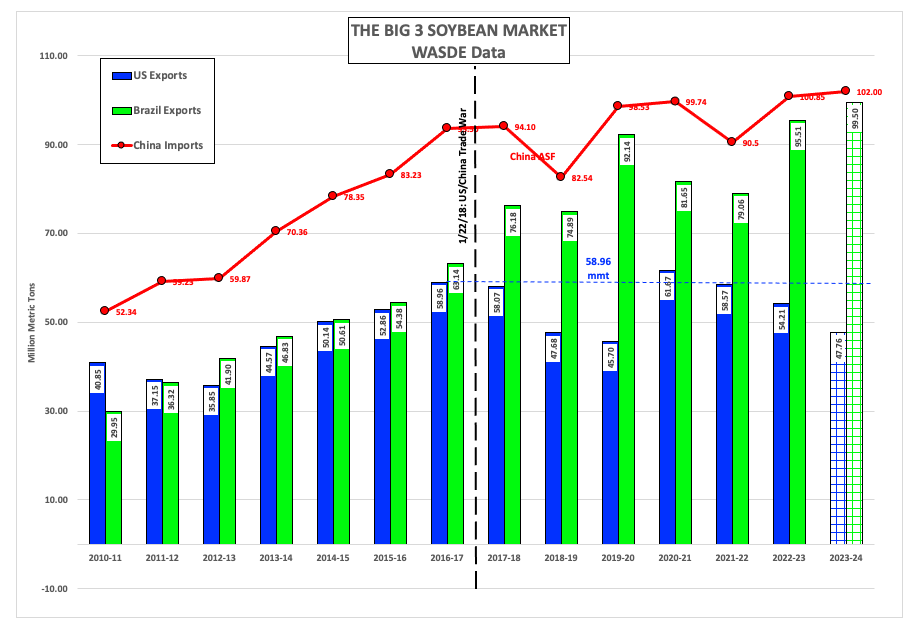
Ah yes, export demand. I’m sure we can all repeat the legendary Tweet by heart: “Trade wars are good, and easy to win.” But as usual, not everything that is posted on the X-site formerly known as Twitter is actually true. In this case, we can see the start of the Twitter-driven Trade War between the US and China was the demarcation point of the former being a great player in the global soybean market. The initial salvos were fired in January 2018, with the USDA showing 2016-2017 marketing year (yes, I know) exports for the US of 58.96 mmt only 7% behind Brazil’s estimated 63.14 mmt. In one year’s time the gap grew by 17 percentage points, with the January 2024 edition of WASDE guesses showing a 42% difference between the two. If the US sees demand pick up beyond February this year, it won’t be enough to make up this great gap. Additionally, through the end of January the US was showing total sales of 38.11 mmt, down 19% from the reported 47.14 mmt the same week the previous marketing year. The US was on pace to ship 300 mb less than last year, as compared to USDA's January guess of 237 mb less.
That’s the bottom line, then. The soybean market has been under pressure from noncommercial selling, to the point this group moved to a record large net-short futures position with little to no fear. This could lead to a round of short covering if the May-July futures spread stays bullish, though this bullishness won’t be enough to make the US a major player in the global market any time soon. There you have it, the soybean market in 3 charts.
[i] Think about it this way: The supply and demand of grain is fluid, always changing, and not defined by a set period of time. I call this the Marketing Year Misdirection. Global soybeans are a great example. Officially the marketing year runs from September 1 through August 31, despite the fact the US is a secondary player in the global soybean market these days. Brazil, a major player, harvests its crop about halfway through the marketing year and China, another major player, has unquenchable demand the whole year through.
[ii] This was also the basis for Newsom’s Market Rule #1: Don’t get crossways with the trend. If you do, you are fighting against global investment money traders who tend to have more money than we do.
More Grain News from Barchart
- Strong Start for Tuesday Corn Trading
- Wheat Futures Fractionally Mixed in AM Positioning
- March Beans Back Over $12
- Soy Futures End Stronger on Monday
On the date of publication, Darin Newsom did not have (either directly or indirectly) positions in any of the securities mentioned in this article. All information and data in this article is solely for informational purposes. For more information please view the Barchart Disclosure Policy here.

/Nvidia%20logo%20by%20Konstantin%20Savusia%20via%20Shutterstock.jpg)

/Apple%20products%20on%20desk%20by%20Ake%20Ngiamsanguan%20via%20iStock.jpg)
/Eli%20Lilly%20%26%20Co_%20by%20Tada%20Images%20via%20Shutterstock.jpg)