
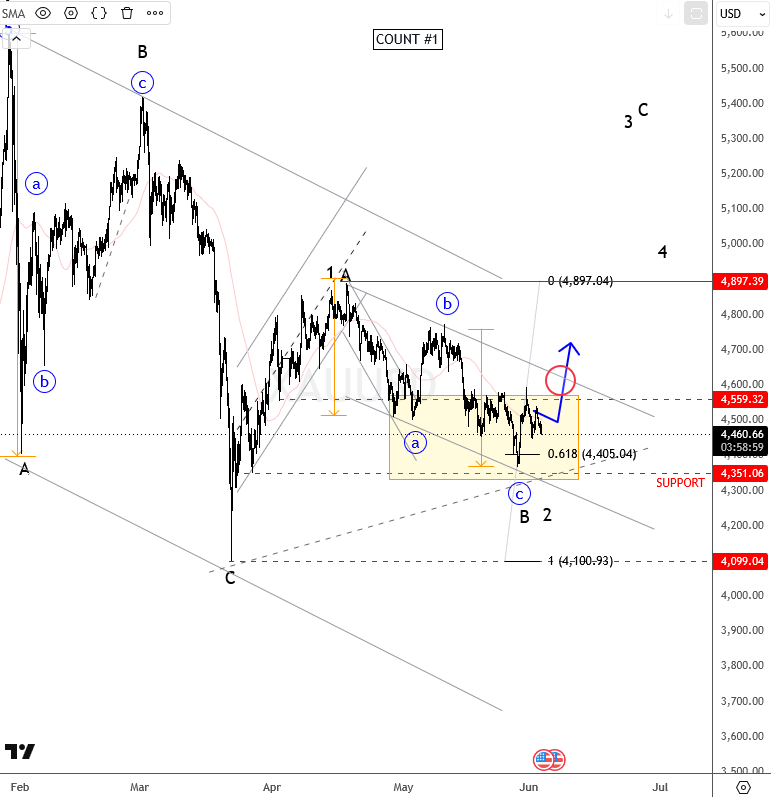
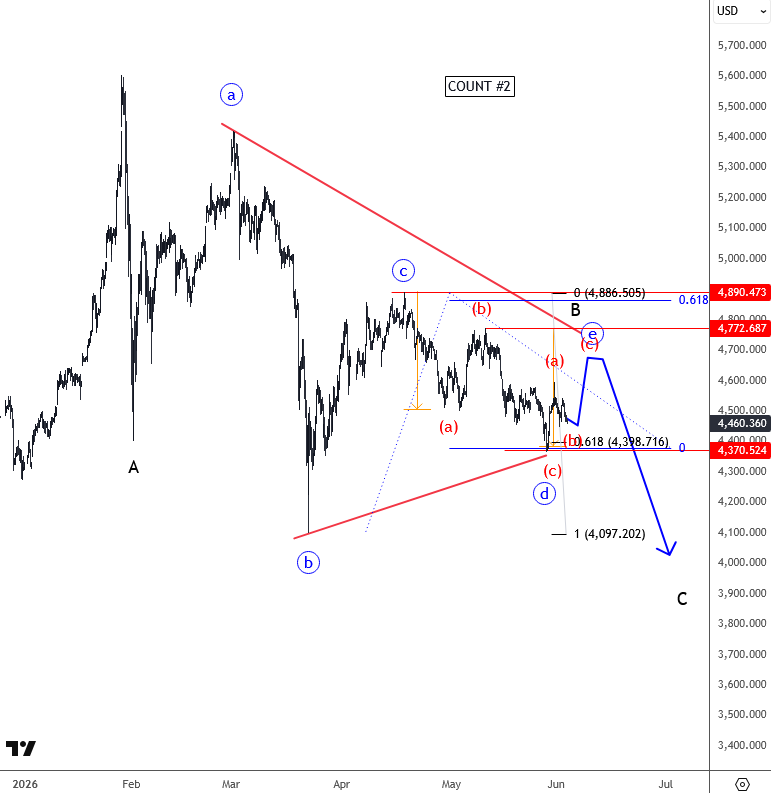
Gold is coming lower for the last few weeks, now trading in third leg of decline, and based on the two counts we are tracking, it looks like this current range between 4000 and 5000 may not be broken anytime soon. What may be important in the near term is that there can be some strength on gold, after recent stabilization at 4400 area, after that drop away from 4900 in three legs, which could either represent : 1: counter trend movement before another recovery back towards 5000 later on, or possibly its 2: wave d of a bearish wave B triangle. In both cases, it looks like there is key zone that can cause more upside, 4700 near-term
When looking at the higher time frame, like the daily chart, we can see that the pullback from the highs is unfolding in three waves. However, if we compare the current wave four to the previous wave two of the same degree, it suggests there could still be more time needed for this higher degree wave four to complete. In fact, this could allow price to move even lower toward a much stronger support zone around 3900, which aligns with the previous wave four of a smaller degree.
For a detailed view and more analysis like this, you can watch below our latest recording of a live webinar streamed on June 1st:
/Microsoft%20Corporation%20logo%20on%20sign-by%20Jean-Luc%20Ichard%20via%20iStock.jpg)
/Dell%20Technologies%20by%20Poetra_RH%20via%20Shutterstock.jpg)