
- The three major US stock indexes completed long-term bullish reversal patterns at the end of October 2022, telling us major trends had turned up.
- However, these same three indexes posted three consecutive lower monthly closes at the end of October, leading to a great deal of squawking about a market “correction”.
- Early November has seen renewed buying interest, due in part to the US FOMC leaving interest rates steady and hinting at a possible end to this rate hike cycle.
While I know it is an actual market term, when the talking heads of financial media start tossing around the word “correction” it tends to get on my nerves. When something is in a “correction”, or “correcting”, the implication is it was wrong to begin with. One can do a spot-check of social media (choose your poison) and find plenty of Chicken Littles with the opinion US stock markets have been wrong the last few years. The squawking tends to center on how terrible their perception of the US economy is, based more on opinions other than the data these same economists hold so dear. But then again, as I’ve said countless times, you could ask the opinion of a dozen economists and come up with 13 different answers. Also, one can't help but wonder about the other old saying, “The market is always right”.
As you know, I am a number of things (feel free to fill in the blank as you wish), but an economist is not one of them. I’m proud of that fact and growing prouder each year I’m in this industry. I’m also bullish US stock indexes since October 2022 when the three major markets completed bullish technical reversal patterns. It’s interesting to note the link attached to the previous article was posted almost exactly a year ago to the day, November 4, 2022. Given the recent pull back in the three markets, let’s take a look at if the long-term monthly charts have changed.
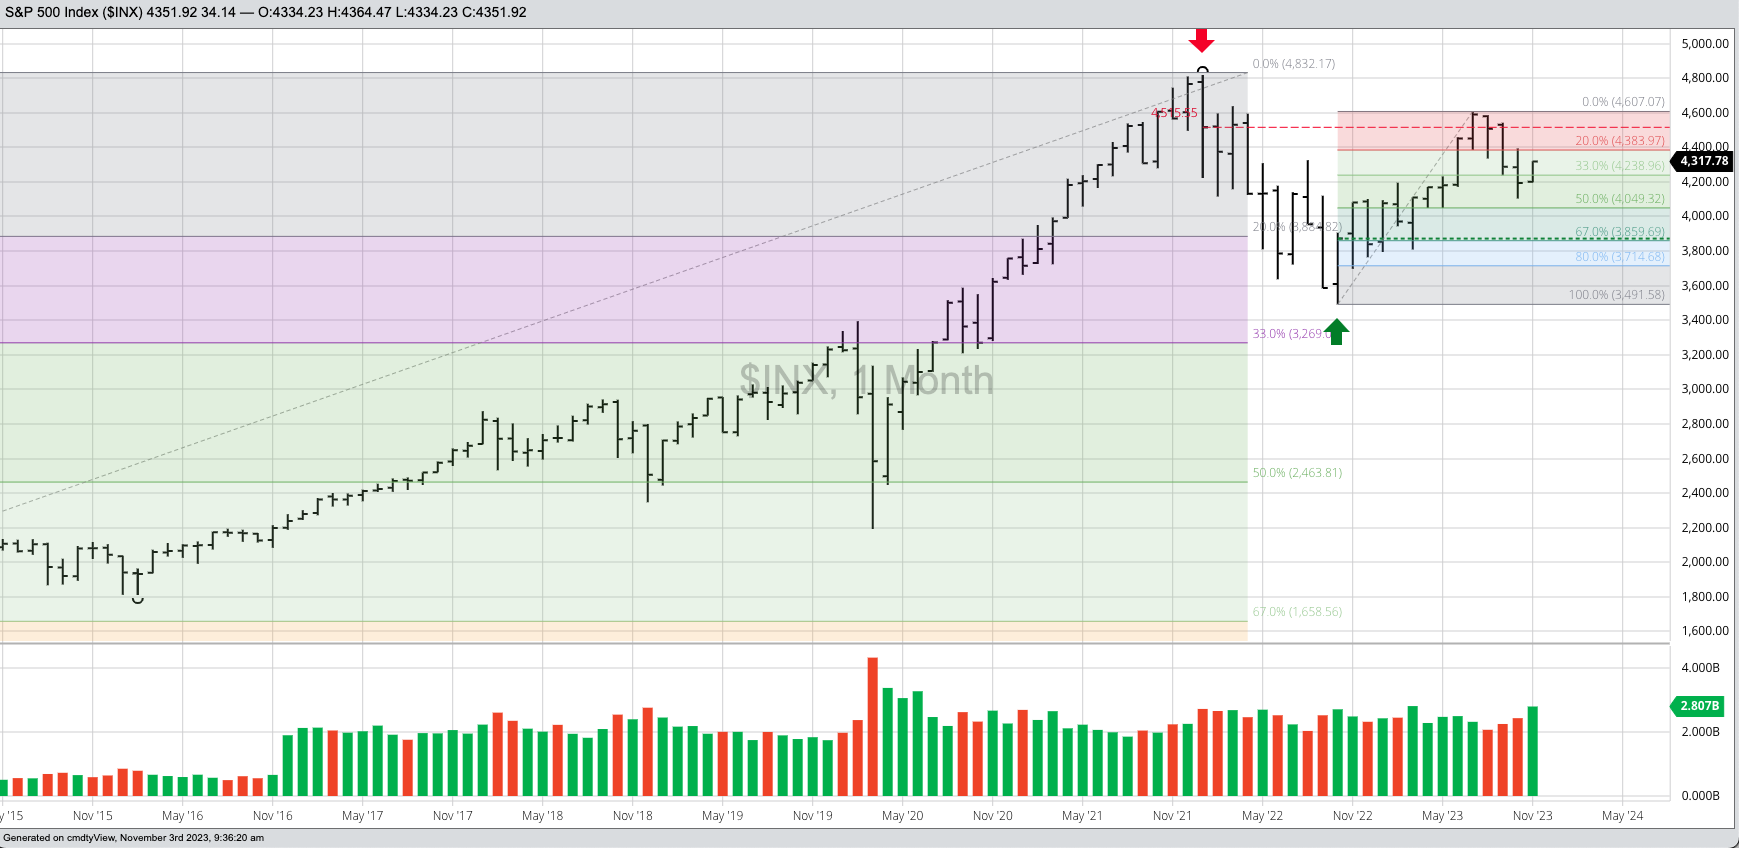
I like to start with the S&P 500 (($INX). The index posted a recent high of 4,607.07 during July before closing just off that mark at 4,588.96. This led to a 3-month selloff, culminating (so far) with the October low of 4,103.78. Note the October low was within sight of the 50% retracement target of the previous up-wave[i]. Included in this move was three consecutive lower monthly closes, bringing to mind a Benjamin Franklin Fish Analogy[ii]. If this holds true, then we would expect the S&P 500 to close higher at the end of November, putting itself on track to extend this wave beyond the July high. What could be the catalyst for such a move? Initial talk following this week’s decision by the US Federal Open Market Committee to hold the Fed fund rate unchanged centered on the theme the end of this rate hike cycle was in sight. If so, Treasury yields would be expected to fall, and investors push more money into equities. It’s still early in the month, wo we’ll see how the rest of November plays out.
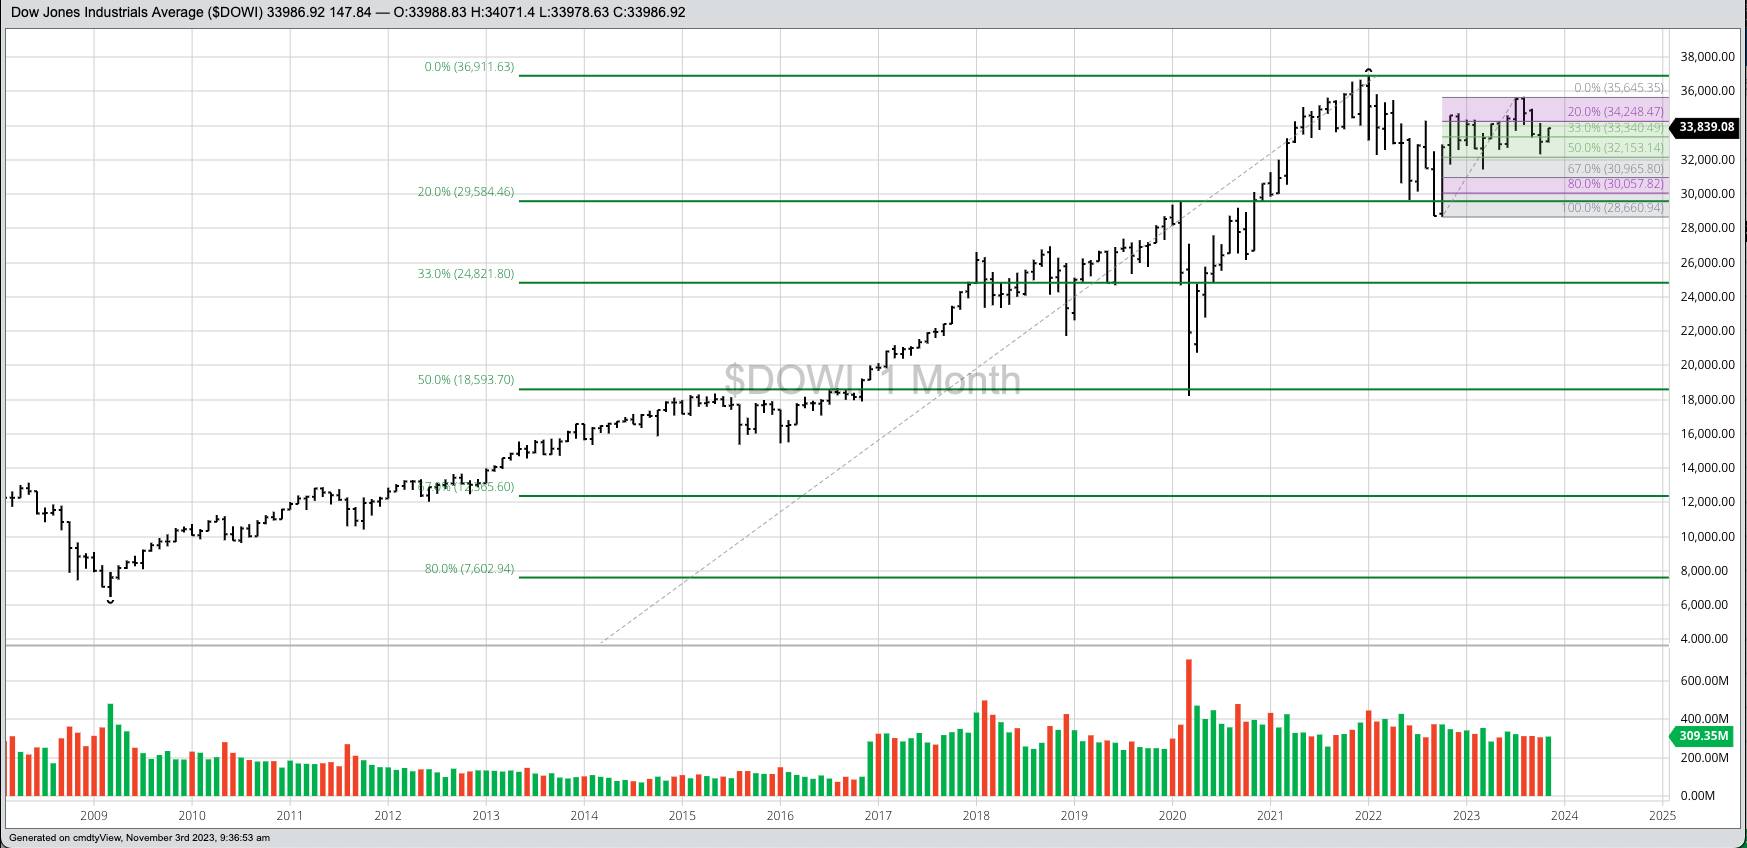
The monthly chart for the Dow Jones Industrial Average ($DOWI) looks similar, though the index extended its previous up-wave to an August high of 35,679.13 before breaking down. Eventually this led to an October low of 32,327.20, again testing to 50% retracement target of the previous move at 32,153.14. November could prove to be a key month, not only for the DJIA but the S&P 500 and Nasdaq as well, with all eyes on the October high of 34,147.63. Seasonally, November and December bullish months for US stock indexes so finding increased investor interest to close out the year would be the norm.

The Nasdaq ($NASX) also posted a high this past July, peaking at 14,446.55 before falling to an October low of 12,543.86. This again brought the index within sight of its 50% retracement target at 12,269.74 before registering a close last month of 12.851.24. As with the other two indexes, the key will be what the Nasdaq does this month, particularly if it can take out the October high of 13,714.14. This would set the stage for a potential challenge of the July mark in the not-too-distant future.
But what if the squawking Chicken Littles are right this time and the October lows don’t hold? What if one or all the major indexes post another lower monthly close at the end of November? First and foremost, this would erase the idea of a Fish Analogy. But would it change the technical analysis? Not necessarily. If one or all of the three indexes took out the respective 50% target level, it would open the door to a possible 67% retracement. Could this trigger a wide-scale market meltdown? The potential is there, but we’ll cross that bridge when at the time.
I wonder if the talking heads would still consider that a “correction”?
[i] A combination of Dow Theory and Elliott Wave Theory.
[ii] Like guests and fish, markets start to stink after three days/weeks/months (whatever time frame is being studied) of moving against the trend.
More Stock Market News from Barchart
- Stocks Rally as Treasury Yields Plunge on U.S. Unemployment Report
- Markets Today: Stocks See Support after Treasury Yields Plunge on U.S. Unemployment Report
- Optimism Is Back! Here Are Three Stocks Flying High Following Earnings!
- Nasdaq Futures Slip as Apple’s Holiday Forecast Disappoints, U.S. Payrolls Data Looms
On the date of publication, Darin Newsom did not have (either directly or indirectly) positions in any of the securities mentioned in this article. All information and data in this article is solely for informational purposes. For more information please view the Barchart Disclosure Policy here.
/Space/Rocket%20launch%20streak%20by%20Alones%20via%20Shutterstock.jpg)
/AI%20(artificial%20intelligence)/Close-%20up%20of%20computer%20chip%20with%20AI%20sign%20by%20YAKOBCHUK%20V%20via%20Shutterstock.jpg)