Today’s pullback in Canola is making the market interesting again.
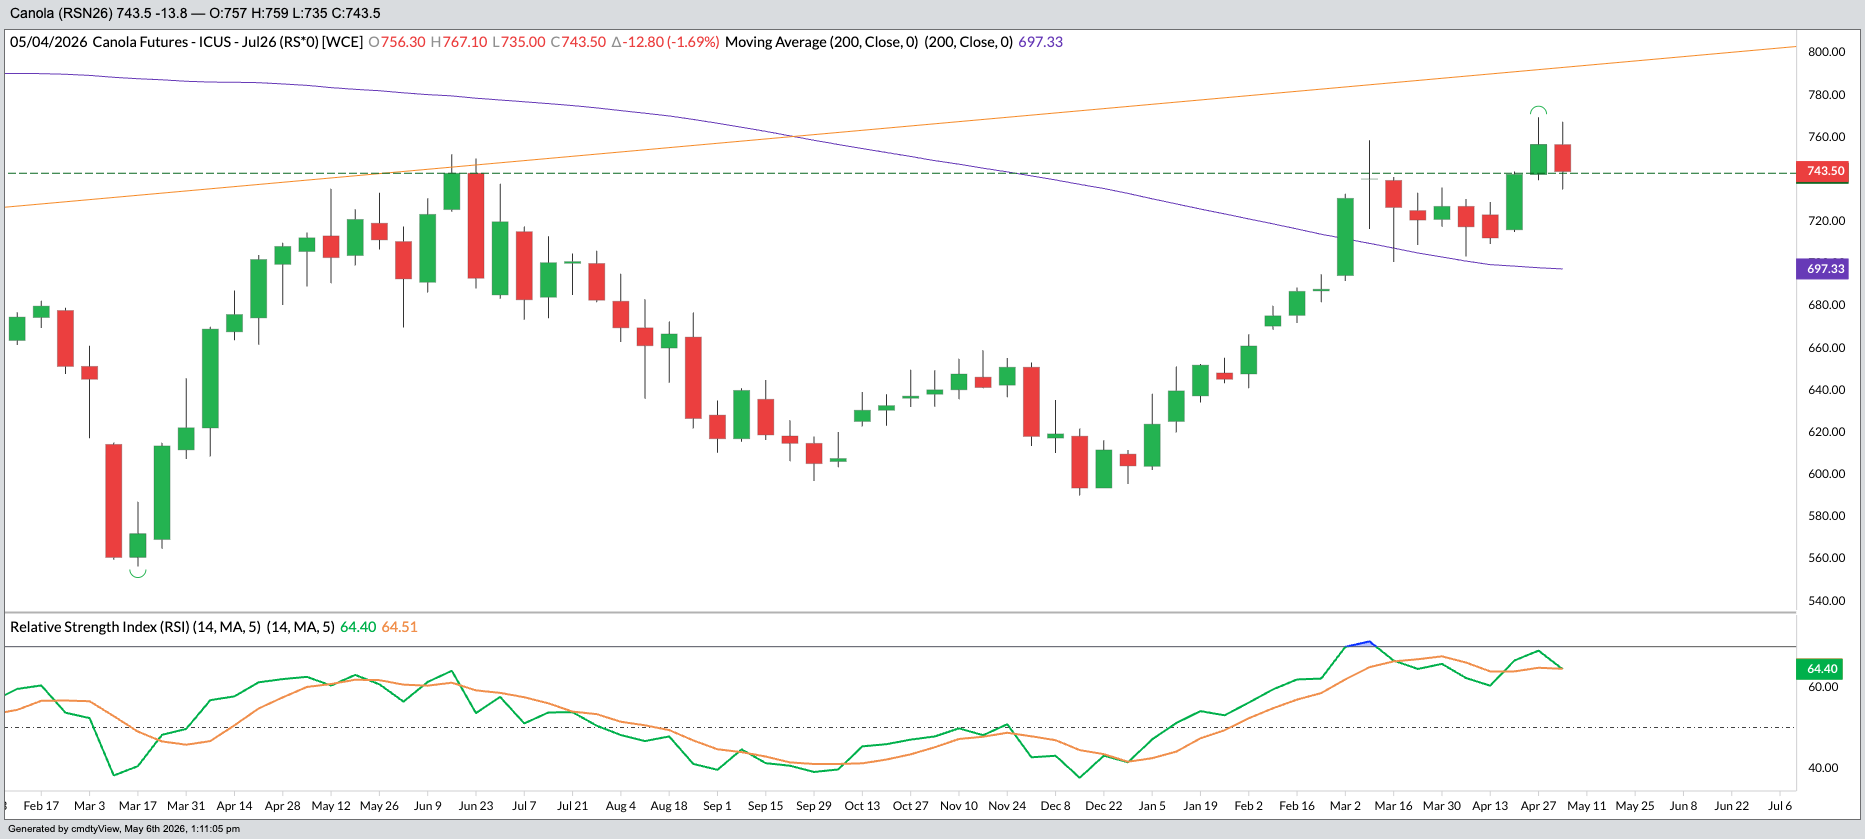
Let us do a top-down approach to this market, beginning with the weekly nearby chart,
Notice the horizontal green dashed line at the June 2025 weekly closing high price.
Notice how significant that level has been to the weekly candle body's open and close over the past two weeks.
We consider this to 742.70 level to be VERY significant. We need that level to hold.
Notice the Bearish divergence between the price and the RSI and how the RSI is crossing below the Signal line.
These present a cautionary tale.
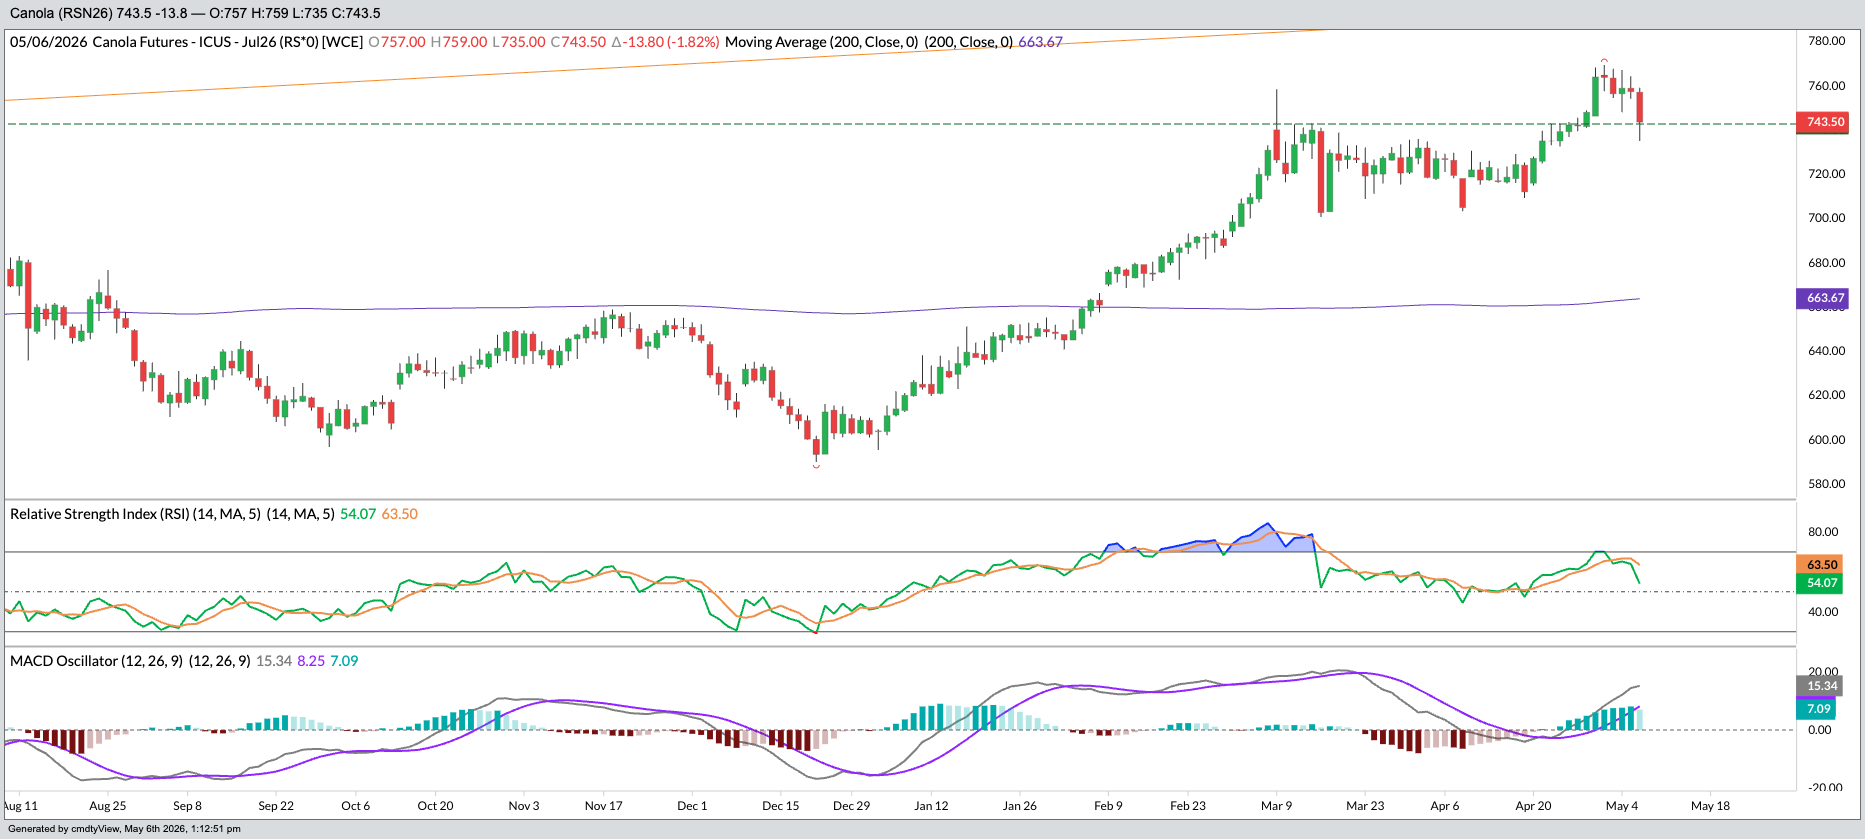
The daily chart below displays buyers stepping in at the previous resistance level.
Bearish Divergence exists between the price and RSI, as well
I cover this technical setup and specific price targets in depth in the Klarenbach Grain Report.
Join 3,500+ farmers getting sell signals and technical roadmaps here:
Trent Klarenbach, BSA AgEc, PAg, publishes the Klarenbach Grain Report and the Klarenbach Special Crops Report.
Klarenbach Research
Sign up below for a FREE trial of our newsletters


