
Shipping and mailing solutions provider Pitney Bowes (NYSE:PBI) met Wall Street’s revenue expectations in Q1 CY2026, but sales fell by 3.2% year on year to $477.4 million. The company’s outlook for the full year was close to analysts’ estimates with revenue guided to $1.83 billion at the midpoint. Its non-GAAP profit of $0.47 per share was in line with analysts’ consensus estimates.
Is now the time to buy Pitney Bowes? Find out by accessing our full research report, it’s free.
Pitney Bowes (PBI) Q1 CY2026 Highlights:
- Revenue: $477.4 million vs analyst estimates of $476.9 million (3.2% year-on-year decline, in line)
- Adjusted EPS: $0.47 vs analyst estimates of $0.47 (in line)
- Adjusted EBITDA: $156 million vs analyst estimates of $153.9 million (32.7% margin, 1.4% beat)
- The company lifted its revenue guidance for the full year to $1.83 billion at the midpoint from $1.81 billion, a 1.1% increase
- Management lowered its full-year Adjusted EPS guidance to $1.25 at the midpoint, a 16.7% decrease
- Operating Margin: 26.5%, up from 19.6% in the same quarter last year
- Free Cash Flow was $43.51 million, up from -$20.46 million in the same quarter last year
- Market Capitalization: $2.19 billion
Company Overview
With a century-long history dating back to 1920 and processing over 15 billion pieces of mail annually, Pitney Bowes (NYSE:PBI) provides shipping, mailing technology, logistics, and financial services to businesses of all sizes.
Revenue Growth
Examining a company’s long-term performance can provide clues about its quality. Even a bad business can shine for one or two quarters, but a top-tier one grows for years.
With $1.88 billion in revenue over the past 12 months, Pitney Bowes is a mid-sized business services company, which sometimes brings disadvantages compared to larger competitors benefiting from better economies of scale.
As you can see below, Pitney Bowes struggled to generate demand over the last five years. Its sales dropped by 12.6% annually, a rough starting point for our analysis.
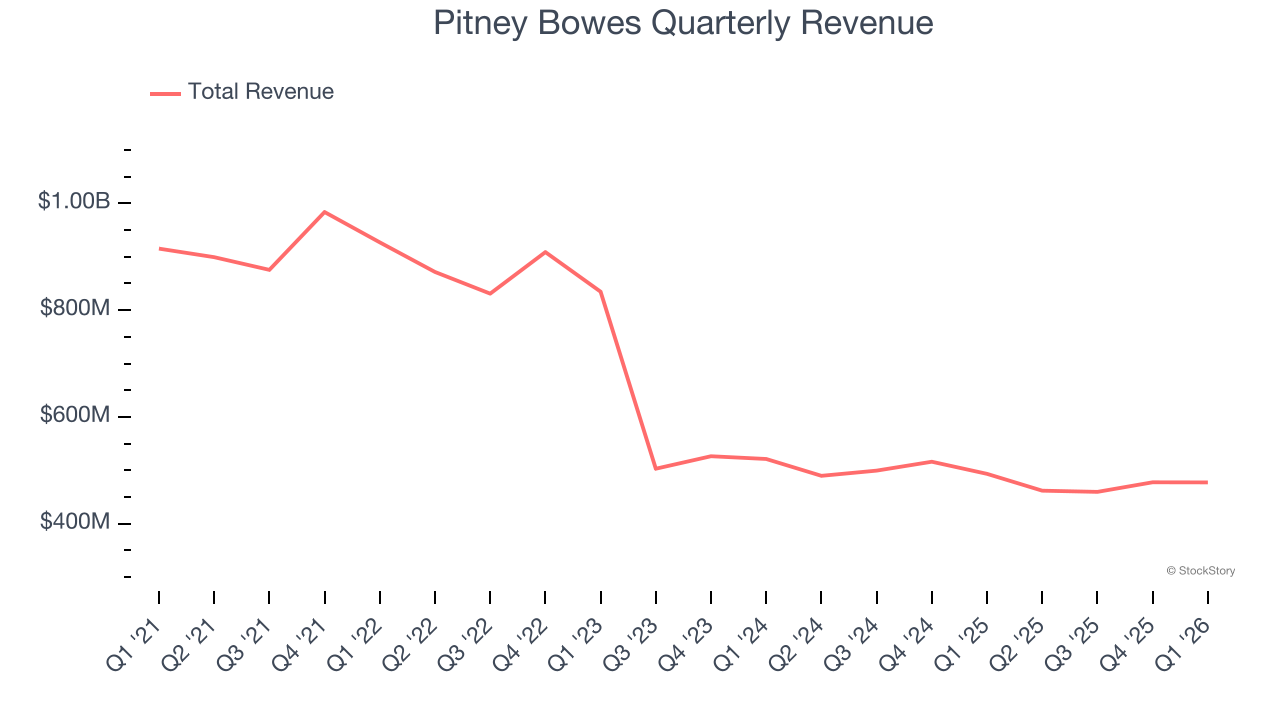
Long-term growth is the most important, but within business services, a half-decade historical view may miss new innovations or demand cycles. Pitney Bowes’s annualized revenue declines of 4.5% over the last two years suggest its demand continued shrinking. 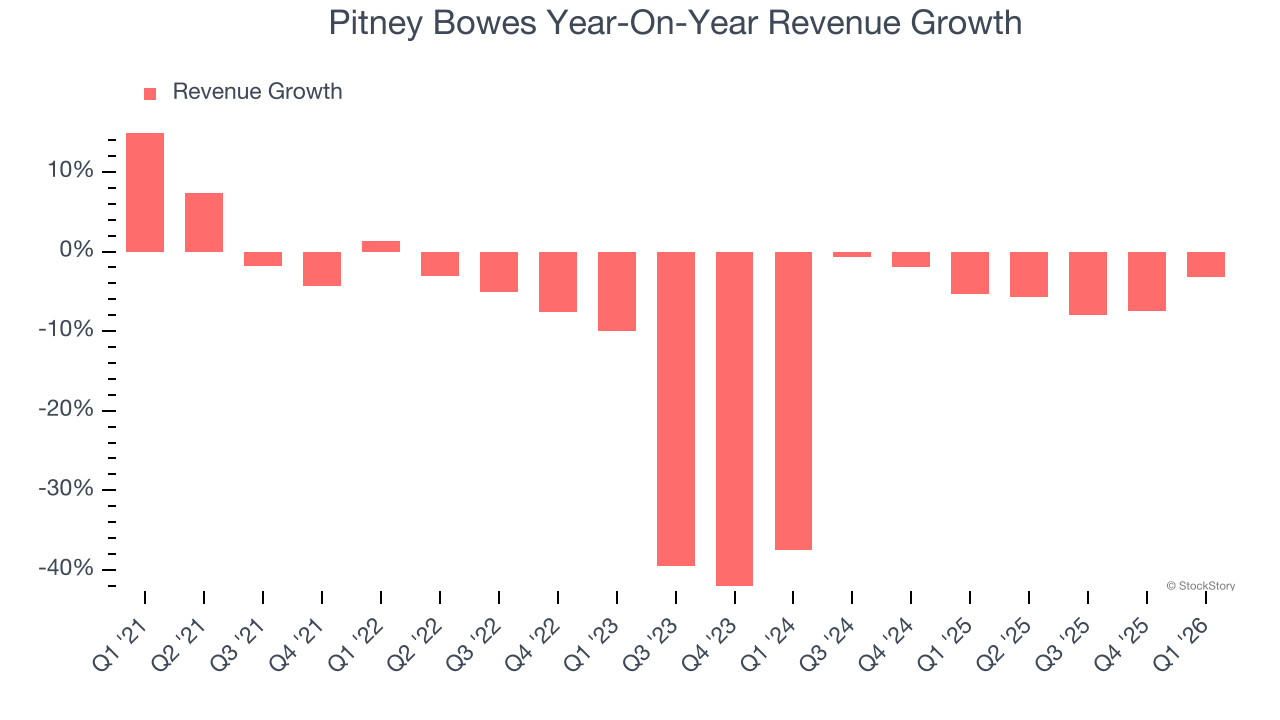
This quarter, Pitney Bowes reported a rather uninspiring 3.2% year-on-year revenue decline to $477.4 million of revenue, in line with Wall Street’s estimates.
Looking ahead, sell-side analysts expect revenue to decline by 2.8% over the next 12 months. While this projection is better than its two-year trend, it’s hard to get excited about a company that is struggling with demand.
ONE MORE THING: The $21 AI Application Stock Wall Street Forgot. While Wall Street obsesses over who’s building AI, one company is already using it to print money. And nobody’s paying attention.
AI chip stocks trade at ridiculous valuations. This company processes a trillion consumer signals monthly using AI and trades at a third of the price. The gap won’t last. The institutions will figure it out. You need to see this first. Read the FREE Report Before They Notice.
Adjusted Operating Margin
Adjusted operating margin is one of the best measures of profitability because it tells us how much money a company takes home after subtracting all core expenses, like marketing and R&D. It also removes various one-time costs to paint a better picture of normalized profits.
Pitney Bowes was profitable over the last five years but held back by its large cost base. Its average adjusted operating margin of 9.1% was weak for a business services business.
On the plus side, Pitney Bowes’s adjusted operating margin rose by 17.4 percentage points over the last five years.
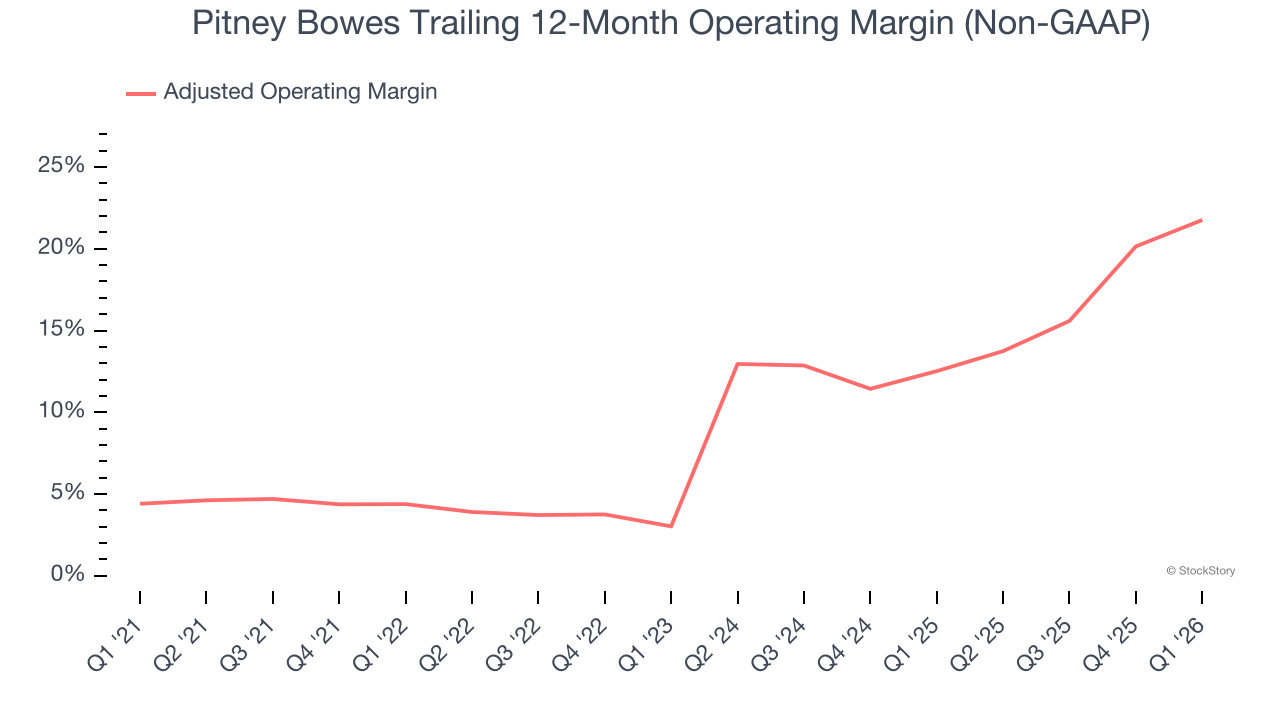
In Q1, Pitney Bowes generated an adjusted operating margin profit margin of 26.5%, up 6.4 percentage points year on year. This increase was a welcome development, especially since its revenue fell, showing it was more efficient because it scaled down its expenses.
Earnings Per Share
We track the long-term change in earnings per share (EPS) for the same reason as long-term revenue growth. Compared to revenue, however, EPS highlights whether a company’s growth is profitable.
Pitney Bowes’s EPS grew at 36.2% compounded annual growth rate over the last five years, higher than its 12.6% annualized revenue declines. This tells us management adapted its cost structure in response to a challenging demand environment.
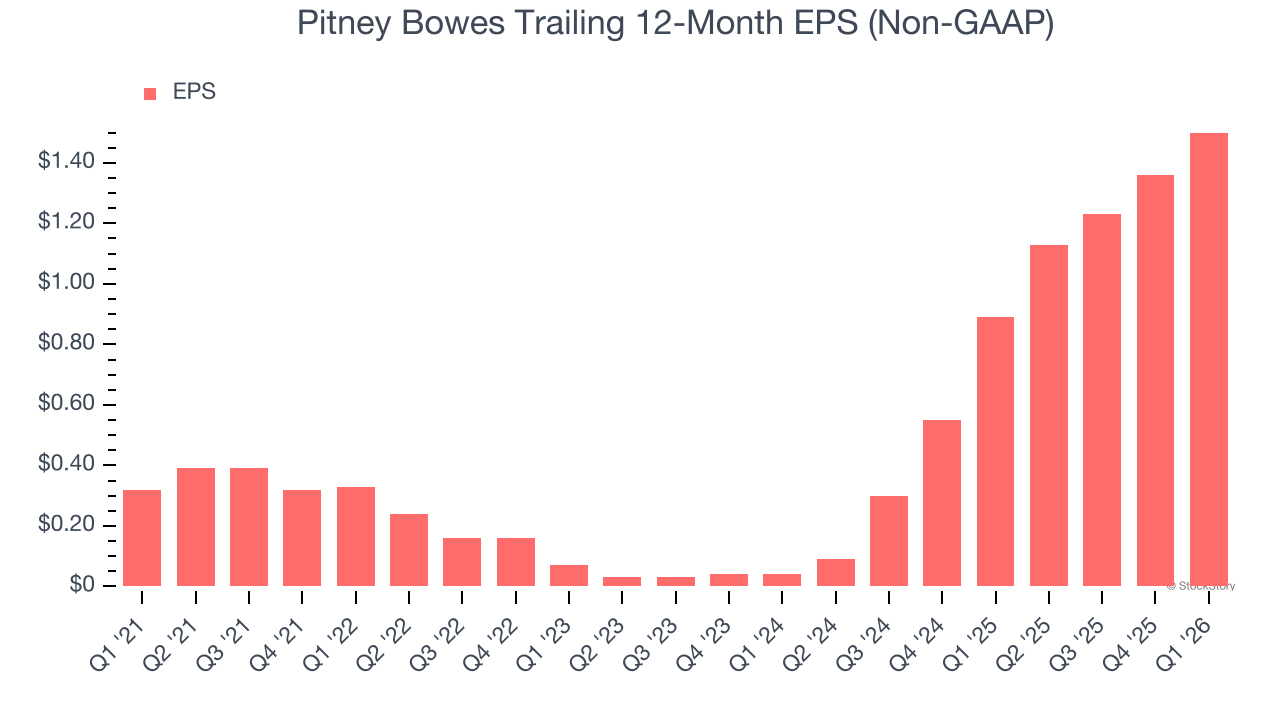
We can take a deeper look into Pitney Bowes’s earnings quality to better understand the drivers of its performance. As we mentioned earlier, Pitney Bowes’s adjusted operating margin expanded by 17.4 percentage points over the last five years. On top of that, its share count shrank by 14.5%. These are positive signs for shareholders because improving profitability and share buybacks turbocharge EPS growth relative to revenue growth. 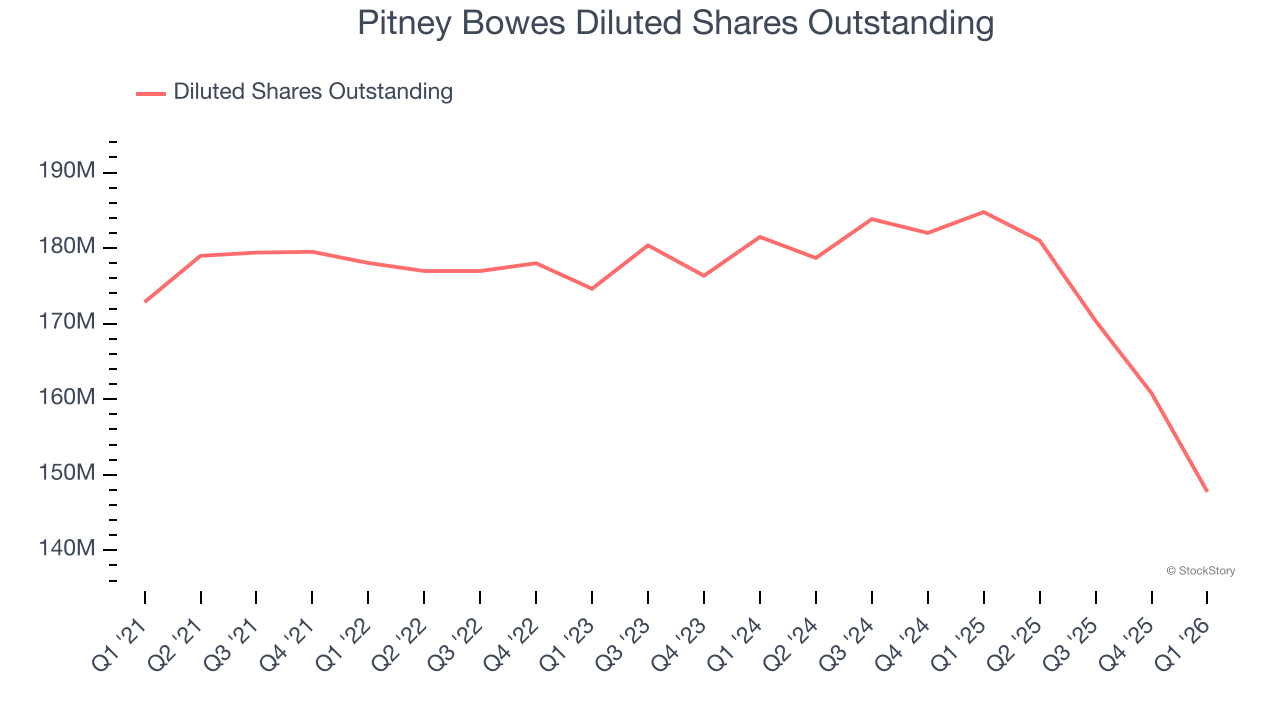
Like with revenue, we analyze EPS over a shorter period to see if we are missing a change in the business.
For Pitney Bowes, its two-year annual EPS growth of 512% was higher than its five-year trend. We love it when earnings growth accelerates, especially when it accelerates off an already high base.
In Q1, Pitney Bowes reported adjusted EPS of $0.47, up from $0.33 in the same quarter last year. This print was close to analysts’ estimates. Over the next 12 months, Wall Street expects Pitney Bowes’s full-year EPS of $1.50 to grow 4.8%.
Key Takeaways from Pitney Bowes’s Q1 Results
We struggled to find many positives in these results. Overall, this was a softer quarter. The stock traded up 2.1% to $15.85 immediately after reporting.
Should you buy the stock or not? The latest quarter does matter, but not nearly as much as longer-term fundamentals and valuation, when deciding if the stock is a buy. We cover that in our actionable full research report which you can read here (it’s free).