
Professional services firm Huron Consulting Group (NASDAQ:HURN) reported revenue ahead of Wall Street’s expectations in Q1 CY2026, with sales up 11.8% year on year to $451.8 million. The company expects the full year’s revenue to be around $1.82 billion, close to analysts’ estimates. Its non-GAAP profit of $1.73 per share was 8% above analysts’ consensus estimates.
Is now the time to buy Huron? Find out by accessing our full research report, it’s free.
Huron (HURN) Q1 CY2026 Highlights:
- Revenue: $451.8 million vs analyst estimates of $448.6 million (11.8% year-on-year growth, 0.7% beat)
- Adjusted EPS: $1.73 vs analyst estimates of $1.60 (8% beat)
- Adjusted EBITDA: $50.59 million vs analyst estimates of $48.65 million (11.2% margin, 4% beat)
- The company reconfirmed its revenue guidance for the full year of $1.82 billion at the midpoint
- Management reiterated its full-year Adjusted EPS guidance of $8.75 at the midpoint
- Operating Margin: 8.1%, in line with the same quarter last year
- Free Cash Flow was -$167.8 million compared to -$115.4 million in the same quarter last year
- Market Capitalization: $2.06 billion
Company Overview
Founded in 2002 during a time of significant regulatory change in corporate America, Huron Consulting Group (NASDAQ:HURN) is a professional services company that helps organizations develop growth strategies, optimize operations, and implement digital transformation solutions.
Revenue Growth
Reviewing a company’s long-term sales performance reveals insights into its quality. Any business can have short-term success, but a top-tier one grows for years.
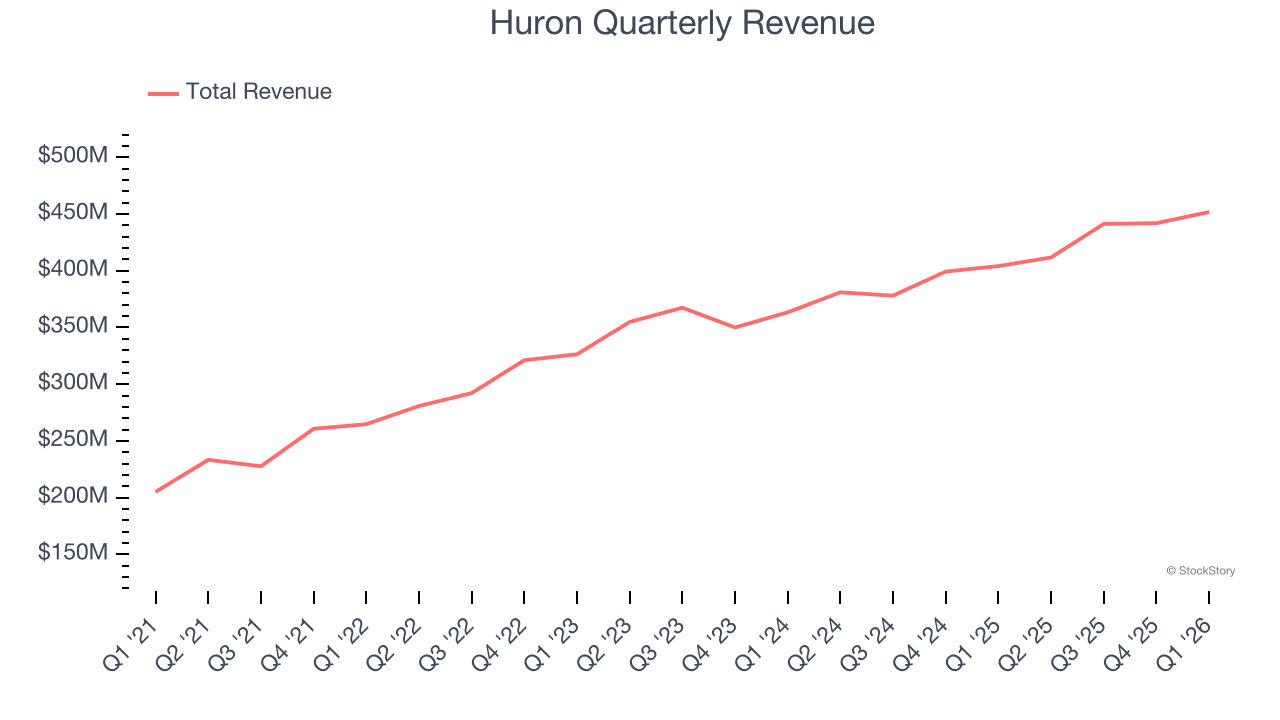
With $1.75 billion in revenue over the past 12 months, Huron is a mid-sized business services company, which sometimes brings disadvantages compared to larger competitors benefiting from better economies of scale. On the bright side, it can still flex high growth rates because it’s working from a smaller revenue base.
As you can see below, Huron grew its sales at an incredible 15.9% compounded annual growth rate over the last five years. This is a great starting point for our analysis because it shows Huron’s demand was higher than many business services companies.
Long-term growth is the most important, but within business services, a half-decade historical view may miss new innovations or demand cycles. Huron’s annualized revenue growth of 10.3% over the last two years is below its five-year trend, but we still think the results suggest healthy demand. 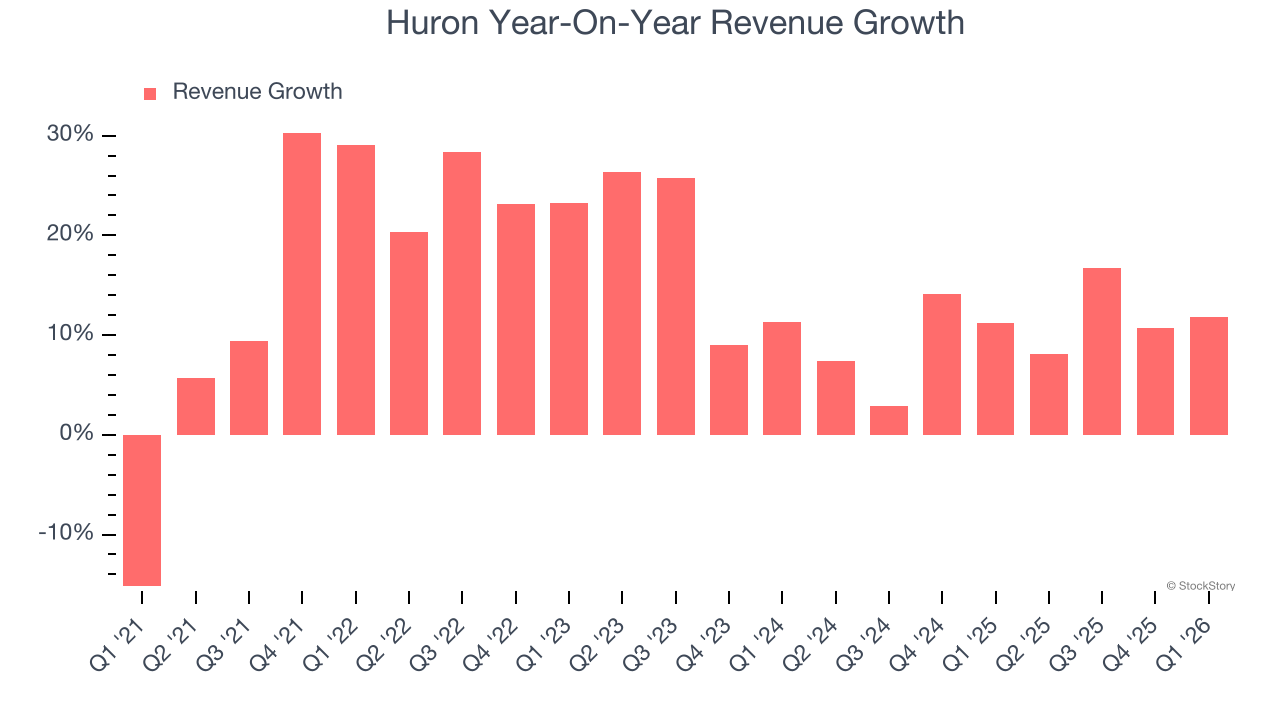
This quarter, Huron reported year-on-year revenue growth of 11.8%, and its $451.8 million of revenue exceeded Wall Street’s estimates by 0.7%.
Looking ahead, sell-side analysts expect revenue to grow 9.4% over the next 12 months, similar to its two-year rate. This projection is commendable and suggests the market is baking in success for its products and services.
ONE MORE THING: The $21 AI Application Stock Wall Street Forgot. While Wall Street obsesses over who’s building AI, one company is already using it to print money. And nobody’s paying attention.
AI chip stocks trade at ridiculous valuations. This company processes a trillion consumer signals monthly using AI and trades at a third of the price. The gap won’t last. The institutions will figure it out. You need to see this first. Read the FREE Report Before They Notice.
Adjusted Operating Margin
Huron was profitable over the last five years but held back by its large cost base. Its average adjusted operating margin of 9.6% was weak for a business services business.
On the plus side, Huron’s adjusted operating margin rose by 5.2 percentage points over the last five years, as its sales growth gave it immense operating leverage.
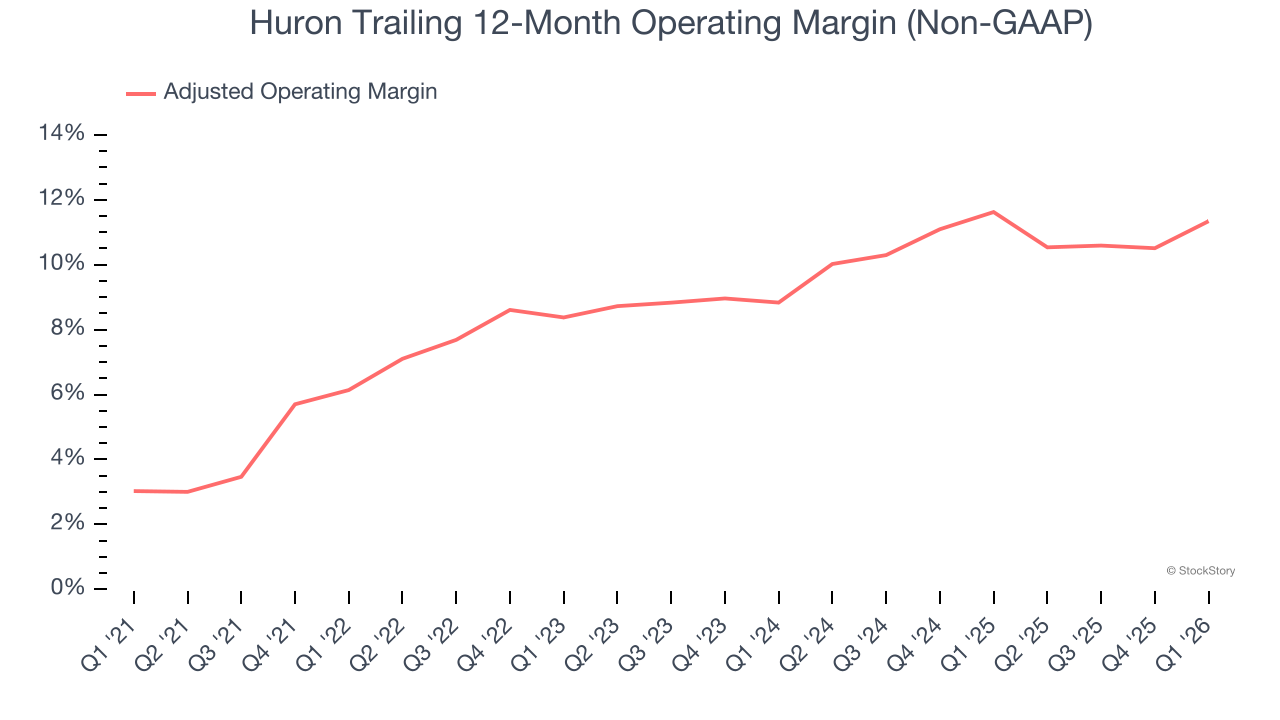
This quarter, Huron generated an adjusted operating margin profit margin of 11.6%, up 3.5 percentage points year on year. This increase was a welcome development and shows it was more efficient.
Earnings Per Share
We track the long-term change in earnings per share (EPS) for the same reason as long-term revenue growth. Compared to revenue, however, EPS highlights whether a company’s growth is profitable.
Huron’s EPS grew at 30.7% compounded annual growth rate over the last five years, higher than its 15.9% annualized revenue growth. This tells us the company became more profitable on a per-share basis as it expanded.
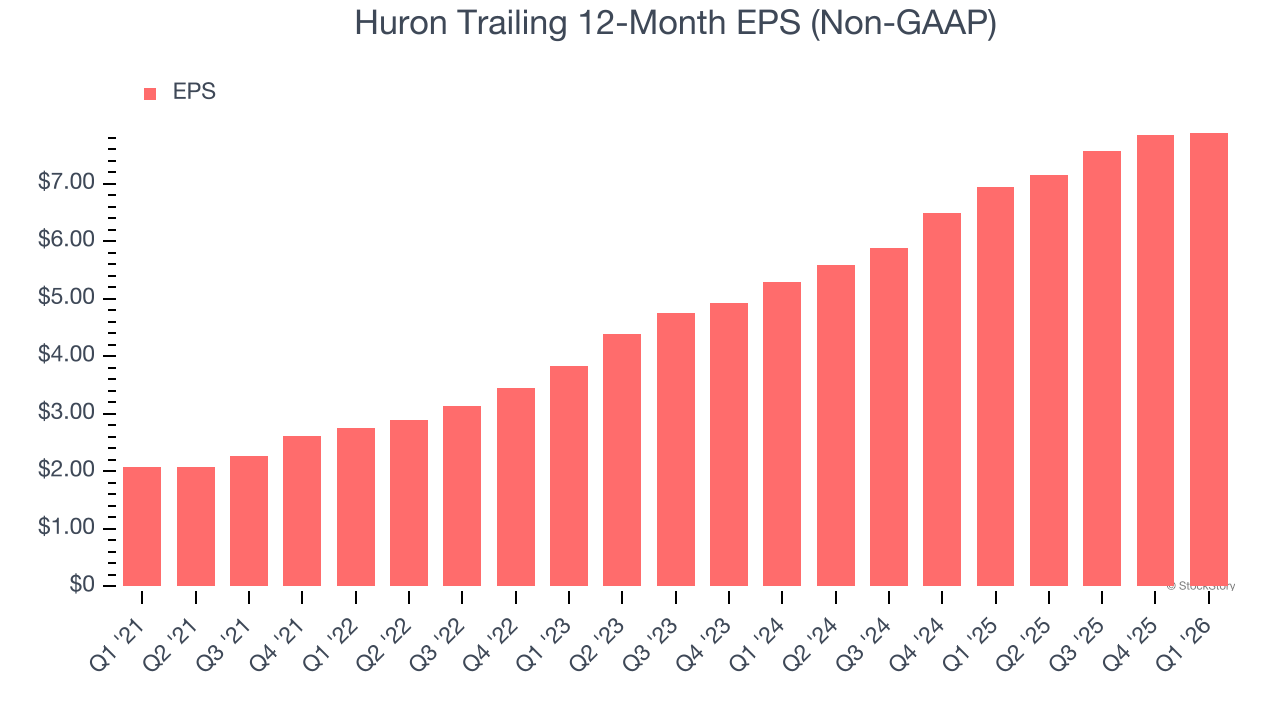
We can take a deeper look into Huron’s earnings to better understand the drivers of its performance. As we mentioned earlier, Huron’s adjusted operating margin expanded by 5.2 percentage points over the last five years. On top of that, its share count shrank by 22.1%. These are positive signs for shareholders because improving profitability and share buybacks turbocharge EPS growth relative to revenue growth. 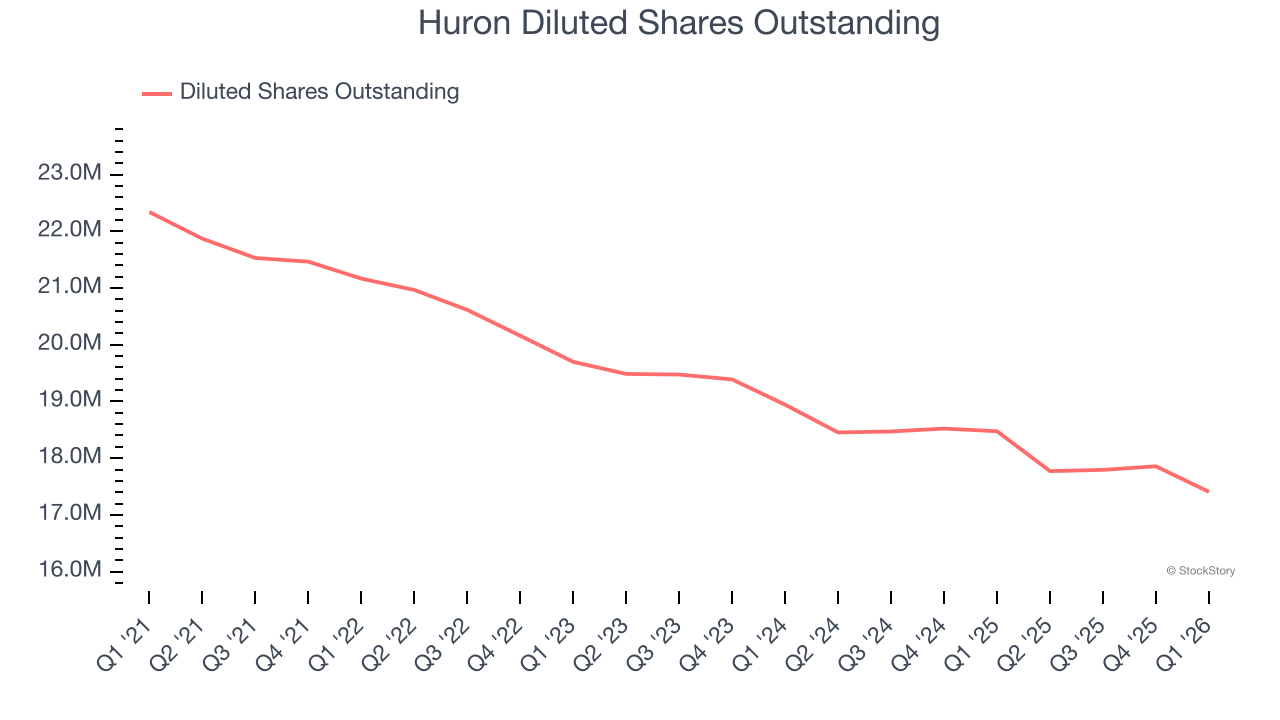
Like with revenue, we analyze EPS over a more recent period because it can provide insight into an emerging theme or development for the business.
For Huron, its two-year annual EPS growth of 22.1% was lower than its five-year trend. We still think its growth was good and hope it can accelerate in the future.
In Q1, Huron reported adjusted EPS of $1.73, up from $1.68 in the same quarter last year. This print beat analysts’ estimates by 8%. We also like to analyze expected EPS growth based on Wall Street analysts’ consensus projections, but there is insufficient data.
Key Takeaways from Huron’s Q1 Results
It was good to see Huron beat analysts’ EPS expectations this quarter. We were also happy its revenue narrowly outperformed Wall Street’s estimates. On the other hand, its full-year EPS guidance slightly missed. Overall, this print had some key positives. The stock traded up 1.8% to $134.59 immediately following the results.
Is Huron an attractive investment opportunity at the current price? We think that the latest quarter is only one piece of the longer-term business quality puzzle. Quality, when combined with valuation, can help determine if the stock is a buy. We cover that in our actionable full research report which you can read here (it’s free).