
Specialized equipment manufacturer for infrastructure and vegetation management Alamo Group (NYSE:ALG) reported Q1 CY2026 results topping the market’s revenue expectations, with sales up 6.7% year on year to $417.1 million. Its non-GAAP profit of $2.56 per share was 16.2% above analysts’ consensus estimates.
Is now the time to buy Alamo? Find out by accessing our full research report, it’s free.
Alamo (ALG) Q1 CY2026 Highlights:
- Revenue: $417.1 million vs analyst estimates of $398 million (6.7% year-on-year growth, 4.8% beat)
- Adjusted EPS: $2.56 vs analyst estimates of $2.20 (16.2% beat)
- Adjusted EBITDA: $59.32 million vs analyst estimates of $51.7 million (14.2% margin, 14.7% beat)
- Operating Margin: 10.1%, down from 11.4% in the same quarter last year
- Free Cash Flow was -$28.02 million, down from $8.19 million in the same quarter last year
- Market Capitalization: $2.09 billion
Robert Hureau, Alamo Group's President, and Chief Executive Officer commented, "We are pleased with the financial results for the first quarter and we believe there is good momentum across many of our key initiatives aimed at creating long-term value for our employees and shareholders."
Company Overview
Expanding its markets through acquisitions since its founding, Alamo (NYSE:ALG) designs, manufactures, and services vegetation management and infrastructure maintenance equipment for governmental, industrial, and agricultural use.
Revenue Growth
A company’s long-term performance is an indicator of its overall quality. Any business can experience short-term success, but top-performing ones enjoy sustained growth for years. Over the last five years, Alamo grew its sales at a mediocre 7% compounded annual growth rate. This fell short of our benchmark for the industrials sector and is a poor baseline for our analysis.
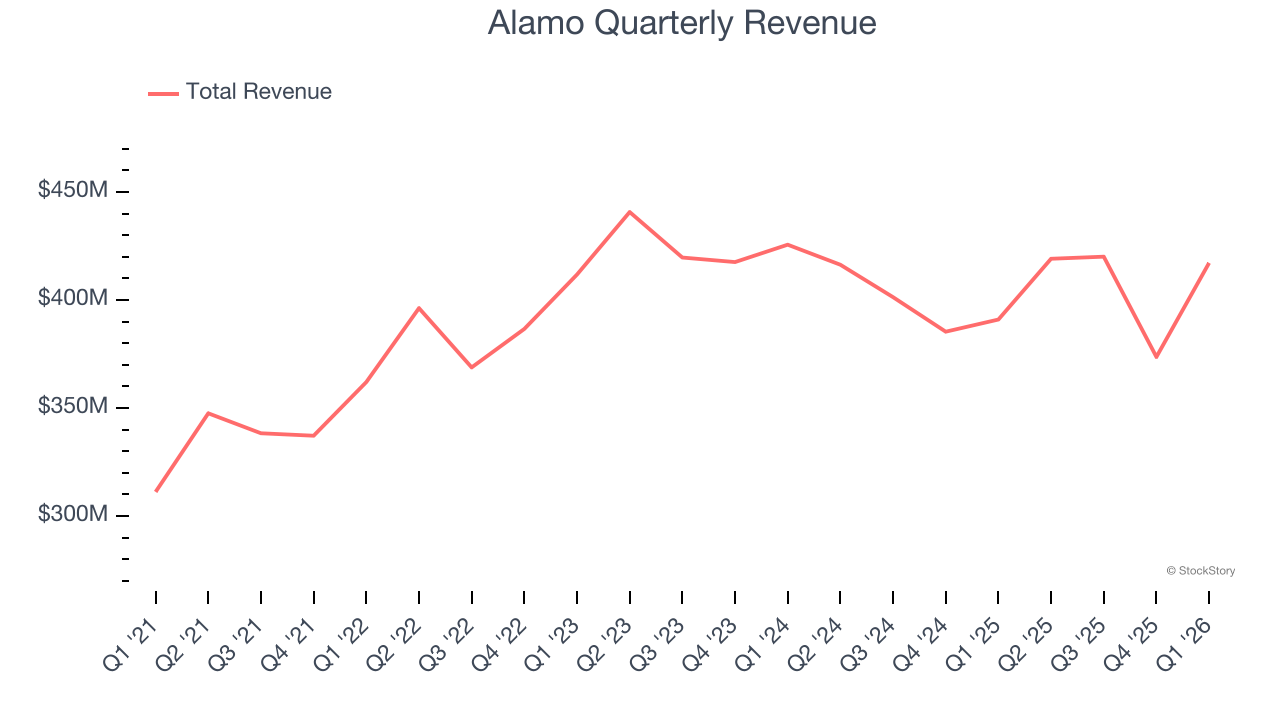
Long-term growth is the most important, but within industrials, a half-decade historical view may miss new industry trends or demand cycles. Alamo’s performance shows it grew in the past but relinquished its gains over the last two years, as its revenue fell by 2.2% annually. 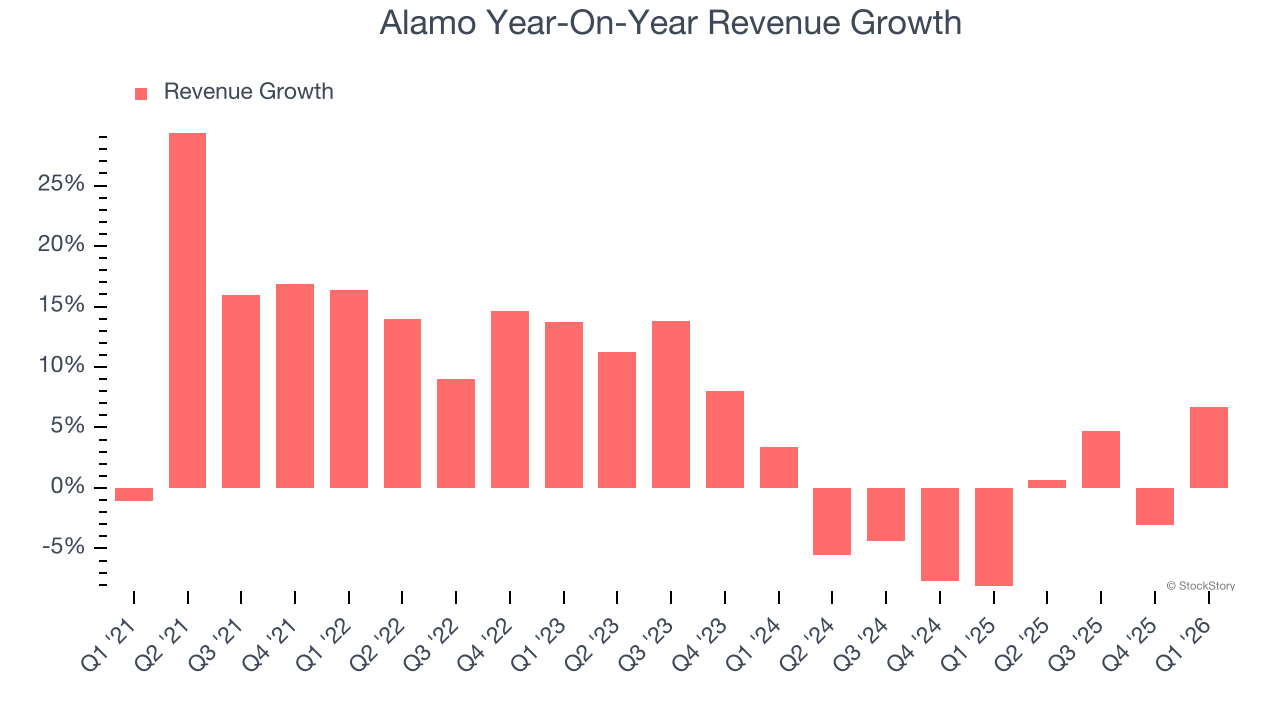
This quarter, Alamo reported year-on-year revenue growth of 6.7%, and its $417.1 million of revenue exceeded Wall Street’s estimates by 4.8%.
Looking ahead, sell-side analysts expect revenue to grow 3.7% over the next 12 months. Although this projection implies its newer products and services will spur better top-line performance, it is still below the sector average.
WHILE YOU’RE HERE: The Next Palantir? One satellite company captures images of every point on Earth. Every single day. The Pentagon wants it. Hedge funds are using it to beat earnings. You’ve probably never heard of it.
This is what the early days of Palantir looked like before it became a $437 billion giant. Same playbook. Different technology. If you missed Palantir, you need to see this. Claim The Stock Ticker for Free HERE.
Operating Margin
Alamo’s operating margin has more or less stayed the same over the last 12 months , averaging 10.1% over the last five years. This profitability was solid for an industrials business and shows it’s an efficient company that manages its expenses well. This result was particularly impressive because of its low gross margin, which is mostly a factor of what it sells and takes huge shifts to move meaningfully. Companies have more control over their operating margins, and it’s a show of well-managed operations if they’re high when gross margins are low.
Looking at the trend in its profitability, Alamo’s operating margin might fluctuated slightly but has generally stayed the same over the last five years. This raises questions about the company’s expense base because its revenue growth should have given it leverage on its fixed costs, resulting in better economies of scale and profitability.
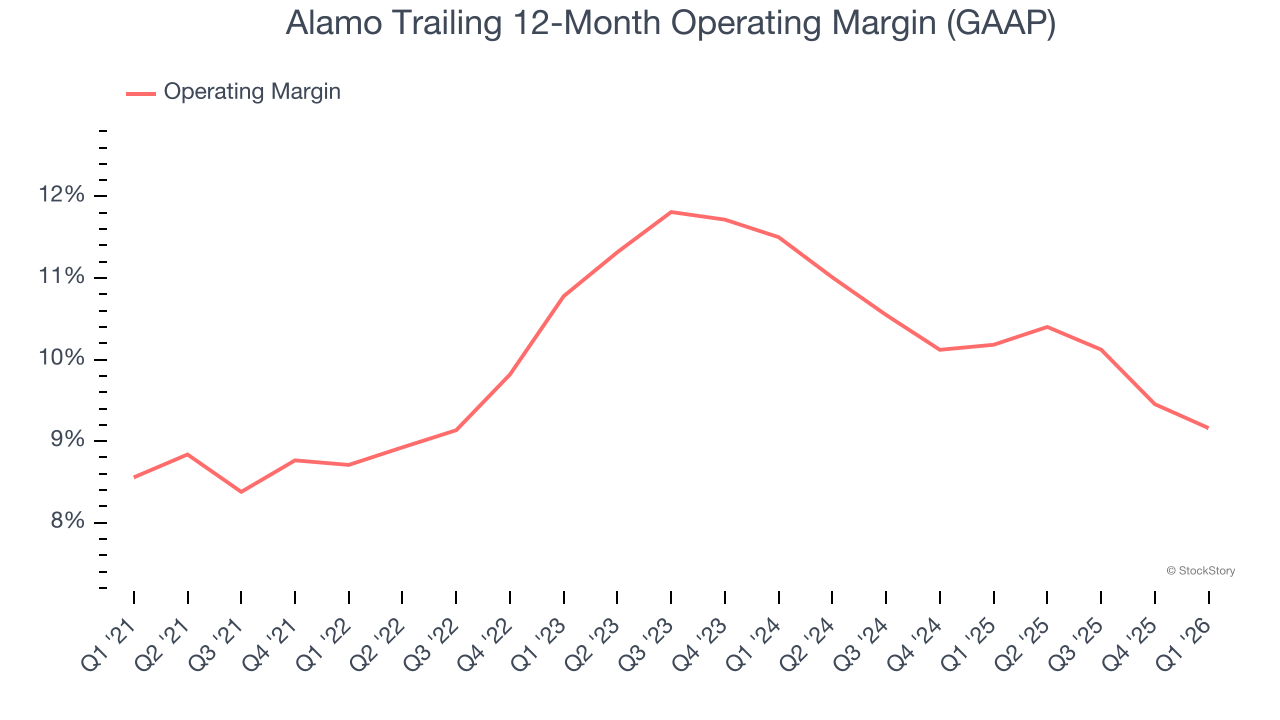
This quarter, Alamo generated an operating margin profit margin of 10.1%, down 1.3 percentage points year on year. Since Alamo’s operating margin decreased more than its gross margin, we can assume it was less efficient because expenses such as marketing, R&D, and administrative overhead increased.
Earnings Per Share
Revenue trends explain a company’s historical growth, but the long-term change in earnings per share (EPS) points to the profitability of that growth – for example, a company could inflate its sales through excessive spending on advertising and promotions.
Alamo’s EPS grew at 11.6% compounded annual growth rate over the last five years, higher than its 7% annualized revenue growth. This tells us the company became more profitable on a per-share basis as it expanded.
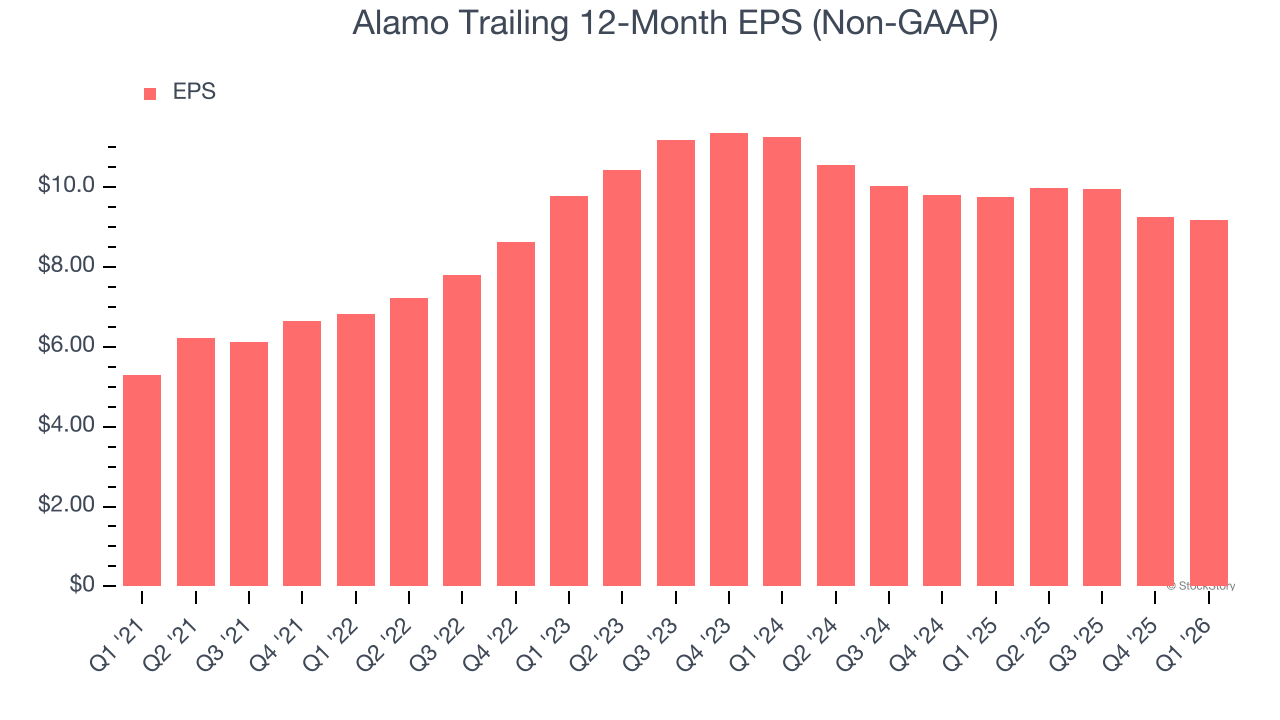
Like with revenue, we analyze EPS over a more recent period because it can provide insight into an emerging theme or development for the business.
For Alamo, its two-year annual EPS declines of 9.7% mark a reversal from its (seemingly) healthy five-year trend. We hope Alamo can return to earnings growth in the future.
In Q1, Alamo reported adjusted EPS of $2.56, down from $2.64 in the same quarter last year. Despite falling year on year, this print easily cleared analysts’ estimates. Over the next 12 months, Wall Street expects Alamo’s full-year EPS of $9.17 to grow 16.3%.
Key Takeaways from Alamo’s Q1 Results
We were impressed by how significantly Alamo blew past analysts’ EBITDA expectations this quarter. We were also excited its adjusted operating income outperformed Wall Street’s estimates by a wide margin. Zooming out, we think this was a good print with some key areas of upside. The stock traded up 3% to $172.75 immediately following the results.
Indeed, Alamo had a rock-solid quarterly earnings result, but is this stock a good investment here? What happened in the latest quarter matters, but not as much as longer-term business quality and valuation, when deciding whether to invest in this stock. We cover that in our actionable full research report which you can read here (it’s free).


/A%20photo%20of%20a%20Sandisk%20Solid%20State%20Drive%20by%20Top%20Popular%20Vector%20by%20Shutterstock.jpg)
/AI%20(artificial%20intelligence)/Data%20Center%20by%20Caureem%20via%20Shutterstock%20(2).jpg)
