
The July sugar futures contract has rallied 1.85 cents (per pound) since hitting its April low of 13.39.
Fundamentally, the market has changed all that much, as indicated by sugar's futures spreads and forward curve.
On the noncommercial side, most of the activity has been short-covering rather than new buying.
Sugar has taken center stage of late, finding its way to the top of most searches for “Hot Commodities”. If we type in “Sugar Prices”, AI tells us, “…recent rise due to higher oil prices encouraging ethanol production and concerns regarding reduced global output”. That is the narrative. Let’s take the market apart to see how much truth there might be to all the hype.
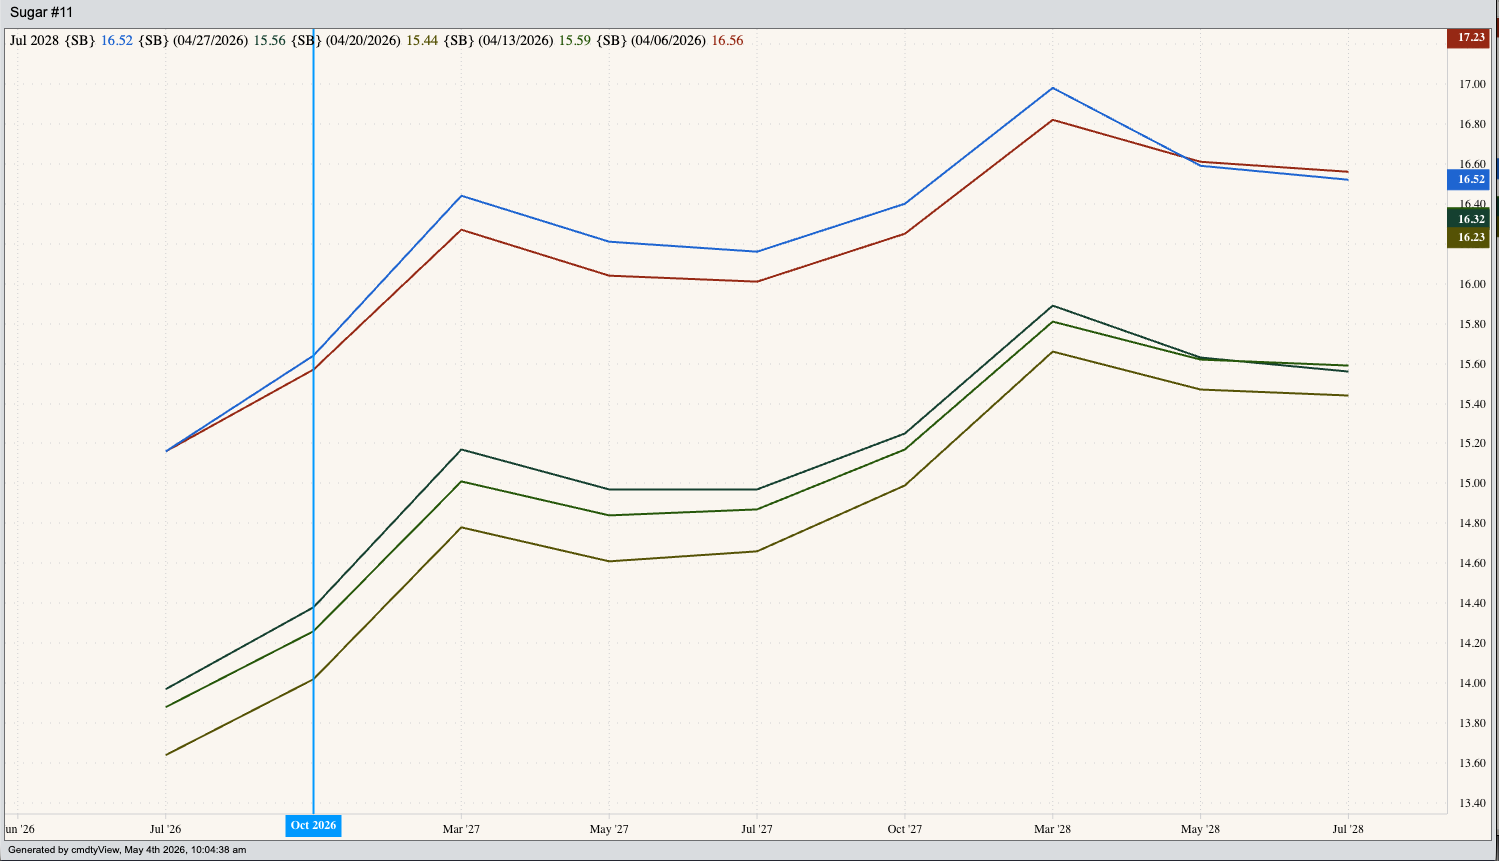
Let’s start with simple fundamental analysis. As usual I’ll start with the market’s futures spreads and forward curve, much to the chagrin of those in the industry who view such things as “nothing more than a snapshot in time”. (Yes, I still remember the stupidity of that comment said to me.) But I digress. At first glance, we see sugar’s forward curve generally slopes up from the lower left corner to the upper right. As of this writing, the July 2026 issue is priced near 15.18 cents (per pound) with the March 2028 issue priced near 16.98. We can also see the curve hasn’t changed much the past four weeks, and oddly enough today’s futures prices (blue line) aren’t all that much different from what was seen on April 6 (red line). What does this tell me? Given the general contango (carry) in the forward curve, the commercial side of the market is not overly concerned about supplies in relation to demand.
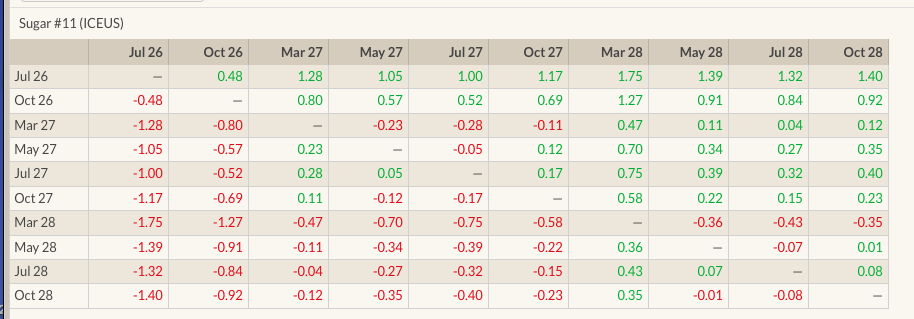
But let’s break down further and look at the market’s spread matrix. Though I’m not a big believer in the concept of a marketing year for crops grown around the world – the largest sugar producers in the world are 1) Brazil (naturally) 2) India 3) China 4) Thailand 5) United States – according to USDA, ‘fiscal years’ begin on October 1. (An interesting difference in wording from ‘marketing year’.) Does this make the October futures contract the first new-crop issue? Or does that honor go to the following March contract? Historically, the honor has belonged to October so for this discussion we’ll start there. The Oct26-Mar27 futures spread is showing a contango/carry of 0.8 cent, after posting a new lifetime low daily close of 0.82 cent last Friday. Remember, the stronger the contango/carry the more bearish a market’s real fundamentals. If there is so much concern over global production, why isn’t this spread trending the other direction?
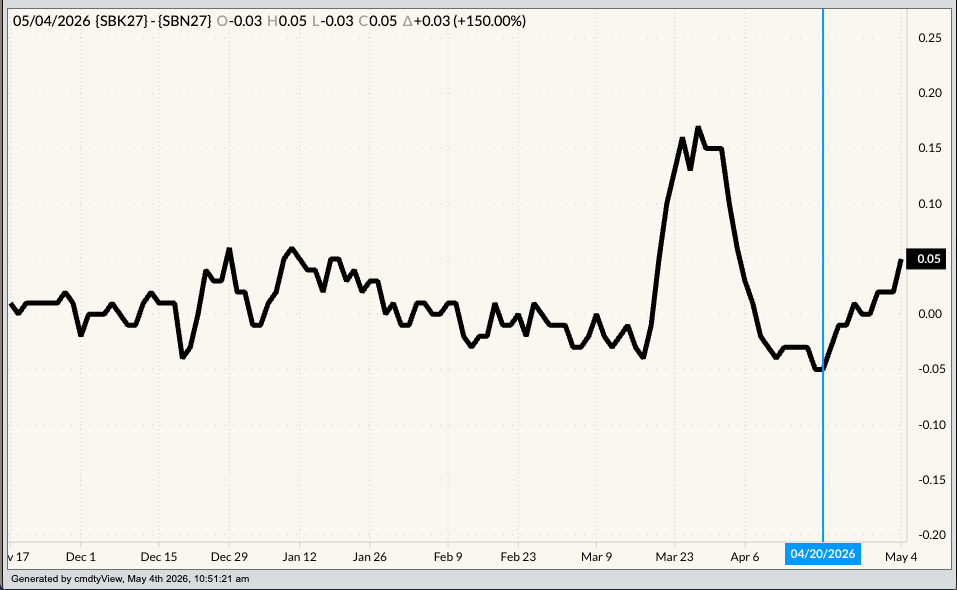
The key is Brazil, where the peak harvest season runs from May through September. Another look at the spread matrix and we see the May-July spread showing a backwardation (inverse) of 0.05 cent. Again, we know that when it comes to a storable commodity like sugar, any backwardation means fundamentals are bullish. The trend of this spread has changed over the past month after posting a low daily close of 0.05 contango on April 20.
Okay, so the sugar market is not screaming a full-blown fundamental bull run. So, what has been driving the market higher the past 3 weeks? The most recent Commitments of Traders report (legacy, futures only), for positions as of Tuesday, April 28, showed a noncommercial bet-short futures position of 143,950 contracts, a decrease of 11,890 contracts from the previous week. Furthermore, funds recently held a net-short futures position of 253,590 contracts on Tuesday, February 17, meaning the market has seen the net-short futures position reduced by 109,640 contracts. Of that, short futures have seen a decrease of 60,590 contracts while 49,050 long contracts were added. In other words, the market is not being driven higher by new buying interest but rather getting out of short positions, most likely at a long-term profit. Is there a difference between those two drivers? Absolutely. One says the market is bullish and could continue to explode higher. The other says the market has gone down far enough.
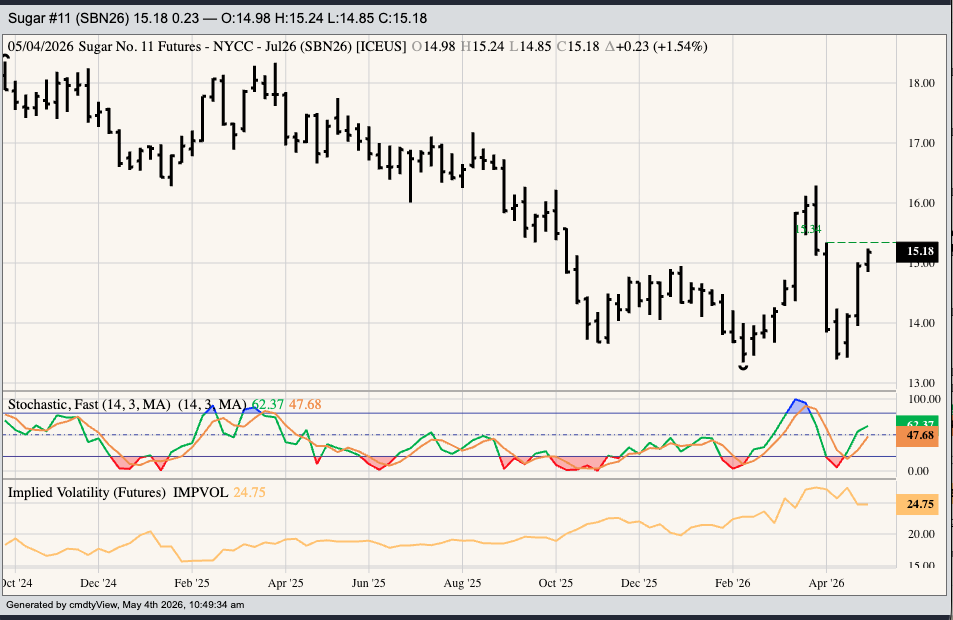
What could trigger a bull run by algorithms, other than the constant barrage of bullish headlines? Recall from a February piece, “3 Steps to a Simple Trading System”, when I talked about using the 4-Week Rule. This is a simple momentum indicator, and since once of the key technical factors driving trade algorithms, which in turn drive trends, is momentum we can use this simple approach to building our own trading system. A look at the weekly chart for July sugar and we see the 4-week high is at 15.34, keeping in mind the contract posted a new 4-week low three weeks ago.
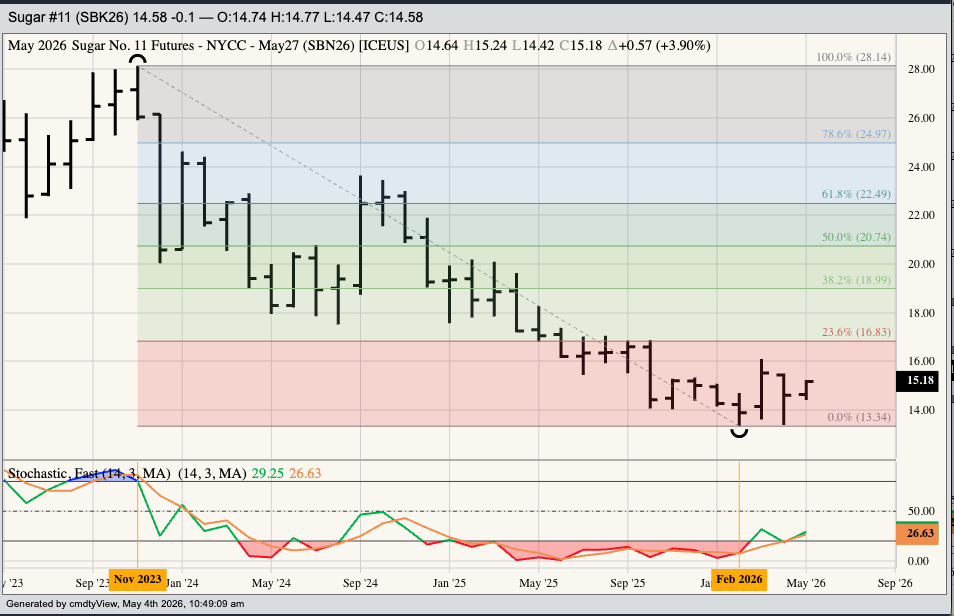
However, if we want to focus on long-term only, in my Monthly Investment Analysis focusing on continuous monthly futures charts for the Softs sector, sugar looks to be in a major uptrend. I’ll have a better feel for the trend depending on which happens first: The nearby contract (SBN26) taking out the March high of 16.10 or February low of 13.34. It’s interesting to note the May contract hit a low of 13.39 during April before rallying.
On the date of publication, Darin Newsom did not have (either directly or indirectly) positions in any of the securities mentioned in this article. All information and data in this article is solely for informational purposes. For more information please view the Barchart Disclosure Policy here.
/A%20close-up%20of%20a%20SpaceX%20sign%20by%20Sundry%20Photography%20via%20Adobe%20Stock.jpeg)

/Green%20hydrogen%20by%20Scharfsinn%20via%20Shutterstock.jpg)
/Abbvie%20Inc%20HQ%20photo-by%20vzphotos%20via%20iStock.jpg)
