Live Cattle & Feeders On The Run, New Targets
The charts are key to this analysis.
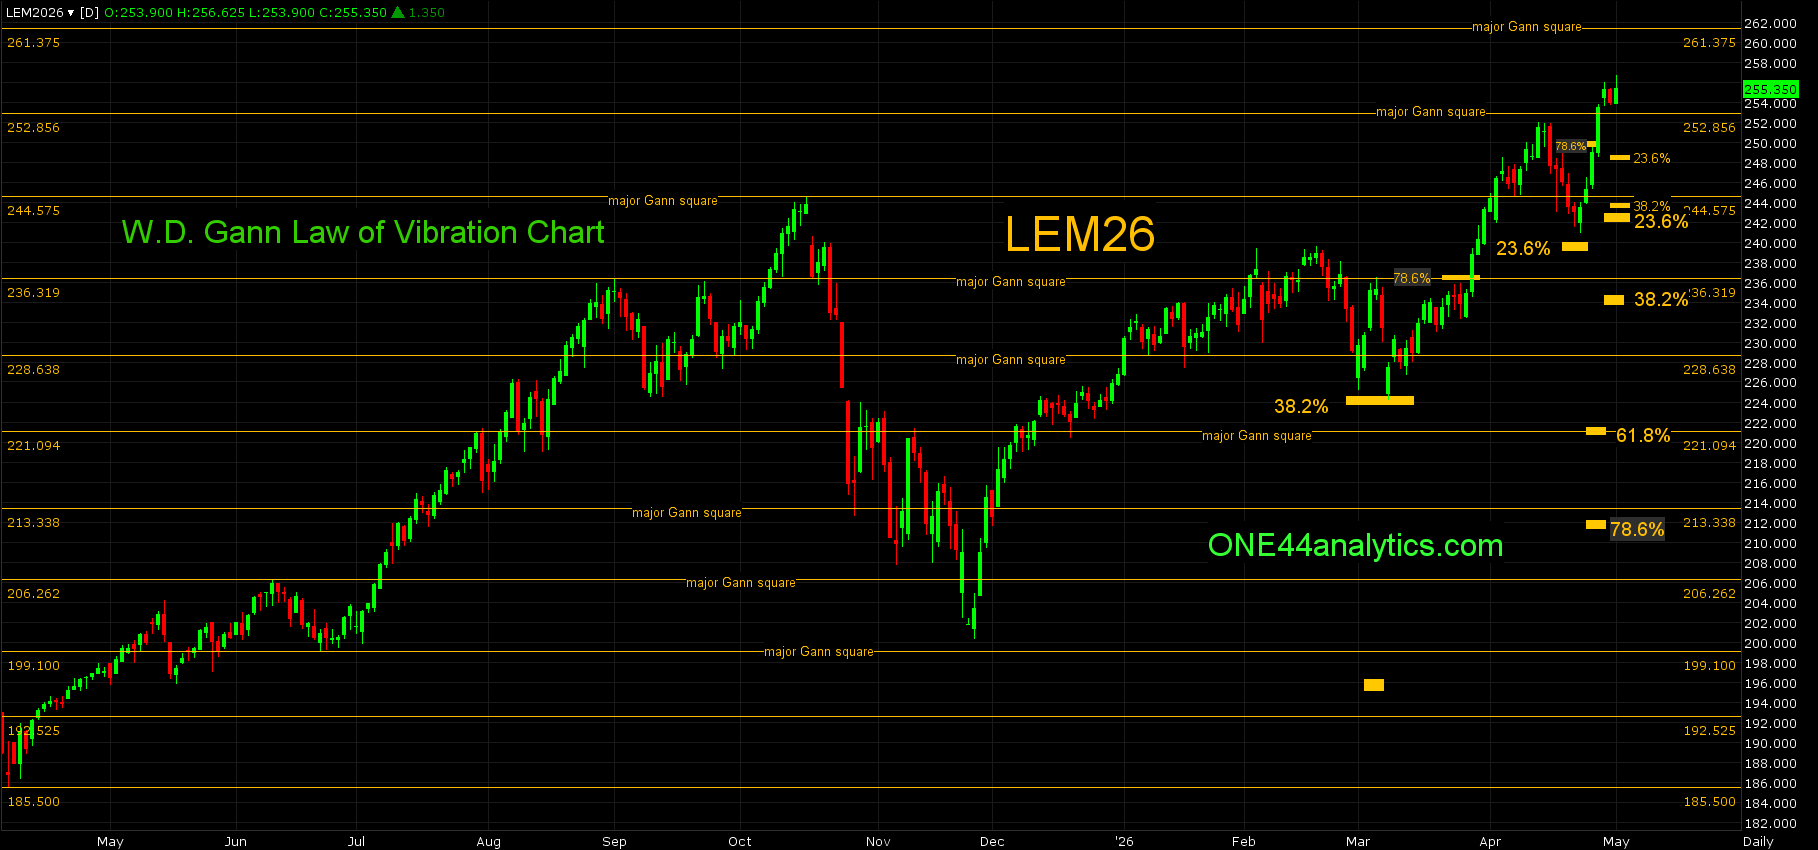
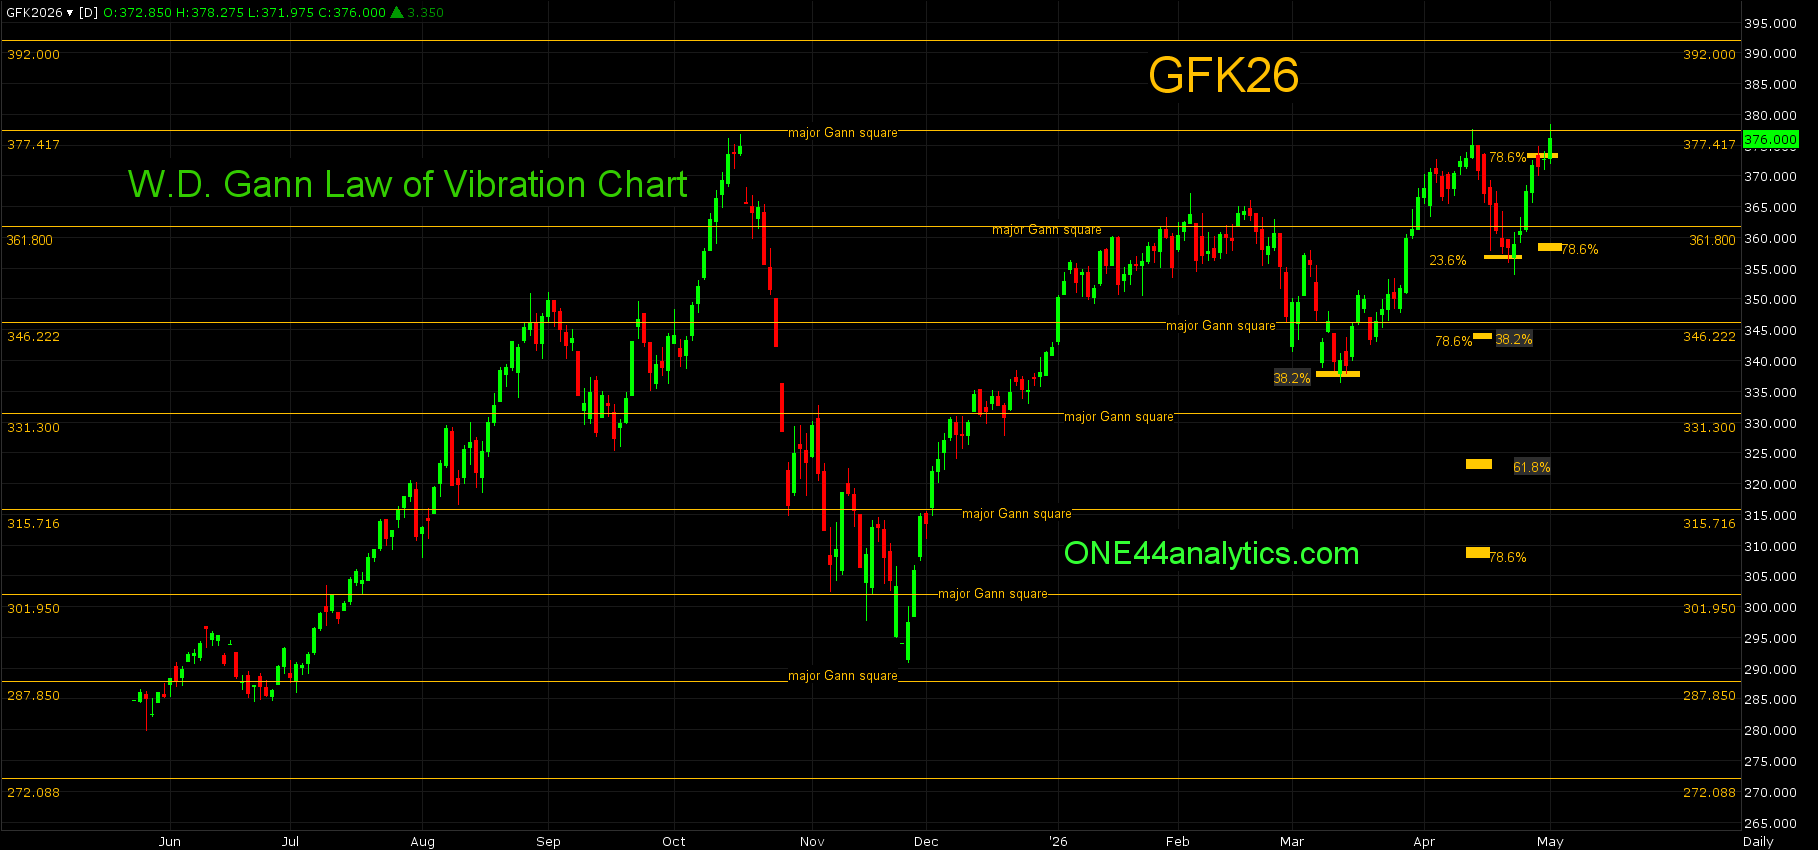
(LEM26) (GFK26)
There are two methods we use at ONE44 to find support and resistance in the markets.
The first are major Gann squares, these are the yellow horizontal lines on the chart.
The second is Fibonacci retracements.
The two key retracements for Live and Feeder Cattle have been the 38.2% & 23.6%.
ONE44 38.2% rule,
Short version
The 38.2% retracement is the single most important and is the level we use for the "Golden Rule". This rule being, " any market that is going to keep its current trend must hold 38.2%". As long as it does the trend will continue and it should make new highs/lows from that retracement.
ONE44 23.6% rule,
Extremely strong/weak markets will only go back 23.6%. This is Typically a runaway market.
As you can see on the charts both markets held the 38.2% retracement perfectly and then went on to new highs as would be expected when following the ONE44 38.2% rule.
The setbacks in April held the 23.6% retracement and went on to an even quicker rally to new highs.
Here is the analysis for the next week from the ONE44 Weekly Grain/Livestock Update.
4/30/26
Livestock
Cattle
June
From last week,
This week's setback has 2 closes below the 244.57 major Gann square and this will be the key level for the week.
Use 244.57 as the swing point for the week.
Above it, the short term target is 78.6% back to the 4/14/26 high at 249.6o. A failure to turn lower from this area will give us only major Gann squares to look for resistance and then use as the swing point when closed above, the next two are 261.37 and 270.05.
The last two setbacks have held key levels to keep the trend strong. The first was on 3/9/26 when it held 38.2% at 224.60 and went on to a new high per the ONE44 38.2% rule and the second was when it held above 23.6% at 240.00 on 4/23/26 and we know that,
Extremely strong/weak markets will only go back 23.6%. This is Typically a runaway market.
The 38.2% retracement kept the trend intact and the 23.6% retracement accelerated it.
There was no turn lower from 78.6% at 249.60 and it now has three closes above the 252.85 major Gann square and this will be the key level for the week.
Use 252.85 as the swing point for the week.
Above it, there are only major Gann squares to look for resistance and then use as the swing point when closed above, the next two are 261.37 and 270.05.
Below it, the two levels to retrace to are 11/25/25 and 3/9/26. The short term target area is 38.2% back to the 3/9/26 low at 244.00 and 23.6% back to the 11/25/25 low at 242.80. The long term target is 38.2% back to the 11/25/25 low at 234.60. Any setback that holds 23.6% back to the 3/9/26 low at 248.70 keeps the trend extremely positive and a new high can quickly follow.
Feeder Cattle
This will be the last update for May.
From last week,
The setback from the 377.41 major Gann square has hit 23.6% back to the 11/25/25 low at 357.20 and this will be the key level for the week. If this is all it can setback, the trend remains extremely strong and a new high can quickly follow.
Use 357.20 as the swing point for the week.
Above it, the short term target is 78.6% back to the 4/14/26 high at 373.00. A failure to...
The rally this week after holding 23.6% at 357.20 hit the short term target of 78.6% at 373.00. A failure to make a new high in this area can be the end of the rally for now per the ONE44 78.6% rule, so this will be the key level for the week
Use 373.00 as the swing point for the week.
Above it, a failure to turn lower from this area will give us only major Gann squares to look for resistance and then use as the swing point when closed above, the next two are 392.00 and 410.63.
Below it, the short term target is 78.6% the other way at 359.00 per the ONE44 78.6% rule. The longer term target area is 346.22 to 344.90, this is a major Gann square, 78.6% back to the 3/12/26 low and 38.2% back to the 11/25/25 low, this is the area that needs to hold to keep the long term trend positive.
ONE44 Analytics where the analysis is concise and to the point
Our goal is to not only give you actionable information, but to help you understand why we think this is happening based on pure price analysis with Fibonacci retracements, that we believe are the underlying structure of all markets and Gann squares.
If you like this type of analysis and trade the Grain/Livestock futures you can become a Premium Member.
You can also follow us on YouTube for more examples of how to use the Fibonacci retracements with the ONE44 rules and guidelines.
Sign up for our Free newsletter here.
FULL RISK DISCLOSURE: Futures trading contains substantial risk and is not for every investor. An investor could potentially lose all or more than the initial investment. Commission Rule 4.41(b)(1)(I) hypothetical or simulated performance results have certain inherent limitations. Unlike an actual performance record, simulated results do not represent actual trading. Also, since the trades have not actually been executed, the results may have under- or over-compensated for the impact, if any, of certain market factors, such as lack of liquidity. Simulated trading programs in general are also subject to the fact that they are designed with the benefit of hindsight. No representation is being made that any account will or is likely to achieve profits or losses similar to those shown. Past performance is not necessarily indicative of future results.


/Visa%20Inc%20gold%20card-by%20hatchpong%20via%20iStock.jpg)
