
Australia is a federal parliamentary democracy and a constitutional monarch, combining features of the British and U.S. political systems. Geographically, Australia is the only country on Earth that covers an entire continent, and it is the flattest and lowest continental landmass on our planet. Australia has no land borders, as it is separated from Asia by the Arafura and Timor seas, and from New Zealand by the Tasman Sea.
Meanwhile, Australia possesses substantial reserves of major mineral and energy commodities, including gold, iron ore, lead, rutile, uranium, vanadium, zinc, and zircon. Australia is a massive exporter of energy commodities, including coal, natural gas, and liquid fuels.
The Australian dollar is highly sensitive to commodity prices, and the country’s location makes it a supermarket for the world’s most populous countries, India and China.
The Australian dollar was in a bear market against the U.S. dollar from 2011 through 2020
The Australian dollar-U.S. dollar relationship reached a record high of $1.10787 in July 2011, after which it ran out of upside steam.
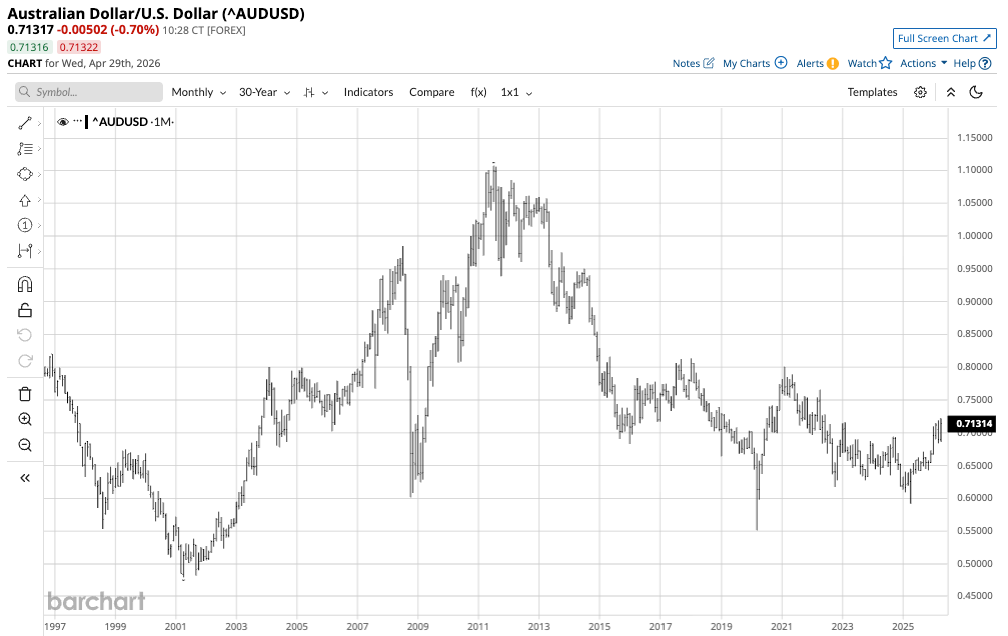
The long-term monthly chart shows that the A$ made lower highs and lower lows against the U.S. dollar, falling to a bottom of $0.55098 in March 2020 when the global pandemic gripped markets across all asset classes. Australia was hit hard by the pandemic, sending the currency relationship to half its 2011 level, as commodity prices fell to lows.
The currency recovered from the 2020 low and entered a consolidation period from 2022 through 2025
The Australian dollar has recovered against the U.S. dollar since the low in March 2020.
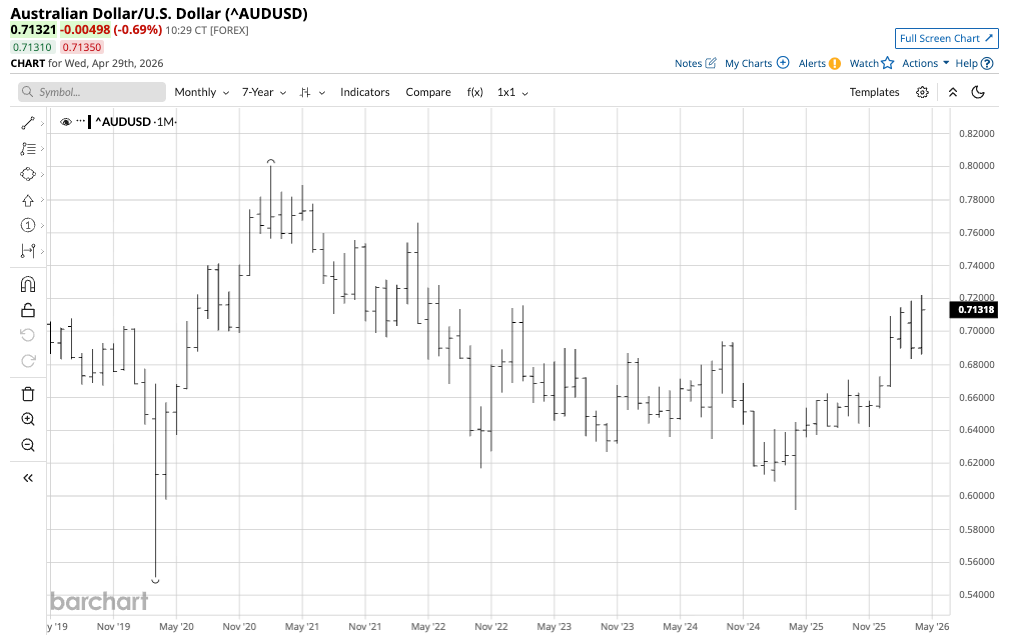
The seven-year monthly chart highlights the 45.3% jump in the currency relationship from the March 2020 low to the February 2021 high. Commodity prices recovered over the period, sending the A$ higher against the U.S. dollar. While the rally ran out of upside steam, falling 26.1% to a low of $0.59155 in April 2025, when the U.S. announced “Liberation Day” tariffs on trading partners, it made a higher low and ran out of downside steam. Over the past year, the A$ has climbed versus the U.S. dollar, making higher lows and higher highs.
The A$ broke above a technical level against the U.S. dollar in early 2026
The five-year monthly chart highlights the A$’s break above a critical technical resistance level against the U.S. dollar.
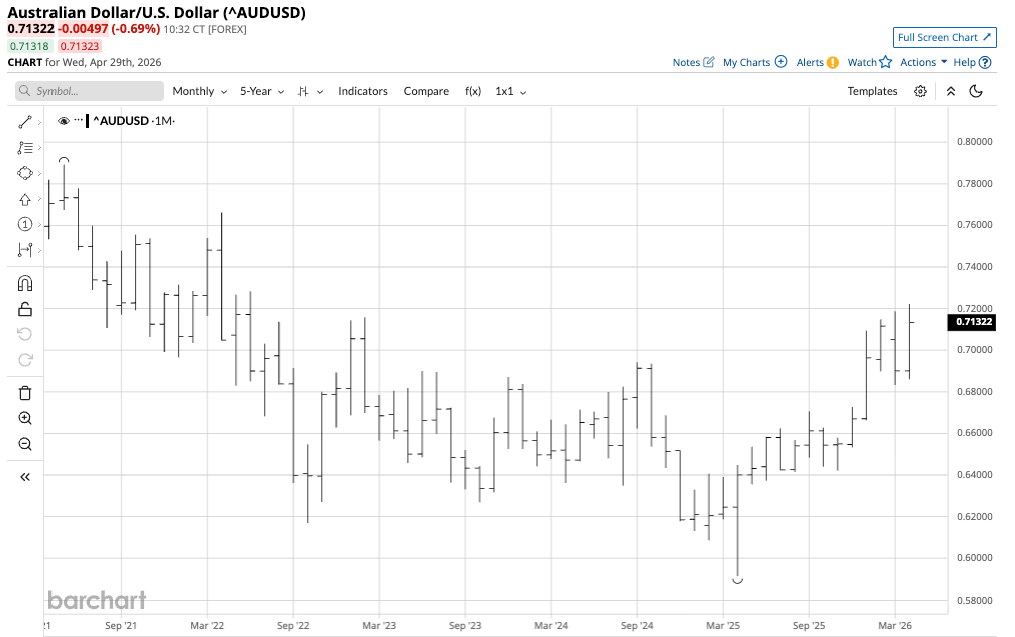
The chart shows the A$ broke above the pattern of lower highs after surpassing the September 2024 high of $0.69418 and the February 2023 high of $0.71578. In April 2026, the currency relationship rose to a high of $0.72216, the highest level since June 2022, a 22% rally from the April 2025 low.
A commodity currency that could have significant upside potential
Commodity prices have been rallying, which supports a rising Australian dollar. As a major raw material supplier to Asia, Australia has seen tax receipts and corporate profits increase due to higher commodity prices.
Meanwhile, as the monthly charts highlight, when trends develop, they tend to last for years. After making lower highs and lower lows from 2011 to 2020 and 2021 to 2025, the path of least resistance has turned higher, which could take the Australian currency substantially higher against the U.S. dollar over the coming months and perhaps years. The first significant technical resistance target for the currency pair is the February 2021 high of $0.80069, over 10% above the most recent high.
The FXA ETF tracks the A$- U.S.$ currency relationship
The most direct route for a risk position in the A$ versus U.S.$ currency relationship is through the highly liquid international foreign exchange market. Several platforms, including the Chicago Mercantile Exchange and the Intercontinental Exchange, provide foreign currency futures contracts.
The Invesco Australian Dollar Trust (FXA) moves higher and lower with the A$ versus U.S.$ currency relationship. At $70.71 per share, FXA had over $106.7 million in assets under management. FXA trades an average of over 16,000 shares per day and charges a 0.40% management fee.
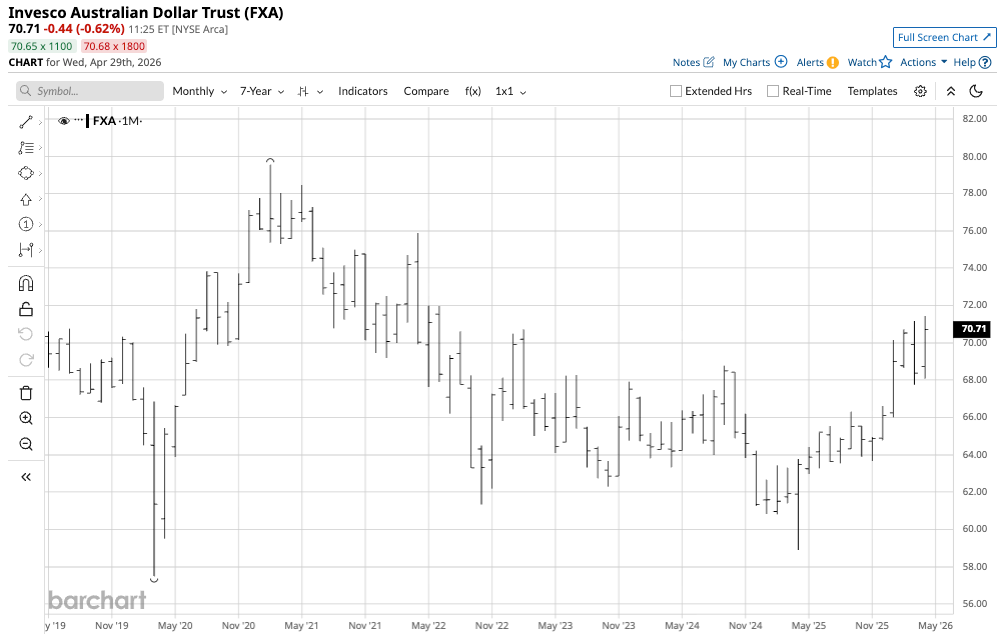
The monthly chart shows that FXA rallied 21.3% from the April 2025 $58.90 low to the most recent high of $71.44 per share in April 2026. FXA does an excellent job tracking the currency relationship. However, the ETF’s one drawback is that it only trades during U.S. stock market hours, while the A$-U.S.$ currency pair trades around the clock. FXA can miss highs or lows when the stock market is closed.
I am bullish on the prospects for the A$ against the U.S. dollar and the FXA ETF, as higher commodity prices are likely to support the Australian currency, which is basically a commodity currency.
On the date of publication, Andrew Hecht did not have (either directly or indirectly) positions in any of the securities mentioned in this article. All information and data in this article is solely for informational purposes. For more information please view the Barchart Disclosure Policy here.
/A%20concept%20image%20showing%20a%20lightbulb%20with%20planet%20earth%20in%20a%20mossy%20green%20background%20by%20Capt_Pic%20via%20Shutterstock.jpg)

/The%20CrowdStrike%20logo%20on%20an%20office%20building%20by%20bluestork%20via%20Shutterstock.jpg)

/An%20image%20of%20a%20Tesla%20humanoid%20robot%20in%20front%20of%20the%20company%20logo%20Around%20the%20World%20Photos%20via%20Shutterstock.jpg)