
Payroll and HR services provider Automatic Data Processing (NASDAQ:ADP) beat Wall Street’s revenue expectations in Q1 CY2026, with sales up 7% year on year to $5.94 billion. Its non-GAAP profit of $3.37 per share was 2.3% above analysts’ consensus estimates.
Is now the time to buy ADP? Find out by accessing our full research report, it’s free.
ADP (ADP) Q1 CY2026 Highlights:
- Revenue: $5.94 billion vs analyst estimates of $5.85 billion (7% year-on-year growth, 1.5% beat)
- Adjusted EPS: $3.37 vs analyst estimates of $3.30 (2.3% beat)
- Adjusted EBITDA: $1.91 billion vs analyst estimates of $1.89 billion (32.1% margin, 0.7% beat)
- Operating Margin: 30.1%, in line with the same quarter last year
- Free Cash Flow Margin: 36.8%, up from 26.8% in the same quarter last year
- Market Capitalization: $80.19 billion
Company Overview
Processing one out of every six paychecks in the United States, ADP (NASDAQ:ADP) provides cloud-based human capital management solutions that help businesses manage payroll, benefits, talent acquisition, and HR administration.
Revenue Growth
A company’s long-term sales performance is one signal of its overall quality. Any business can put up a good quarter or two, but many enduring ones grow for years.
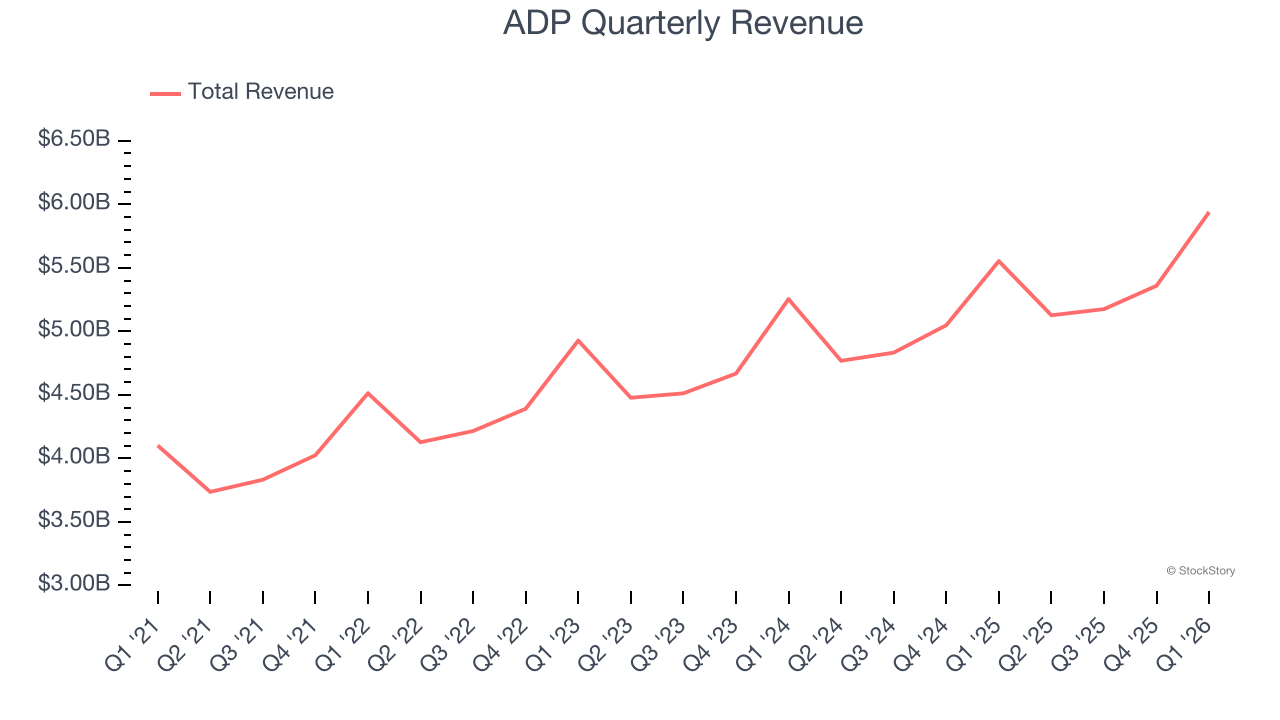
With $21.6 billion in revenue over the past 12 months, ADP is a behemoth in the business services sector and benefits from economies of scale, giving it an edge in distribution. This also enables it to gain more leverage on its fixed costs than smaller competitors and the flexibility to offer lower prices.
As you can see below, ADP grew its sales at a solid 8.1% compounded annual growth rate over the last five years. This is a good starting point for our analysis because it shows ADP’s demand was higher than many business services companies.
We at StockStory place the most emphasis on long-term growth, but within business services, a half-decade historical view may miss recent innovations or disruptive industry trends. ADP’s annualized revenue growth of 6.9% over the last two years is below its five-year trend, but we still think the results were respectable. 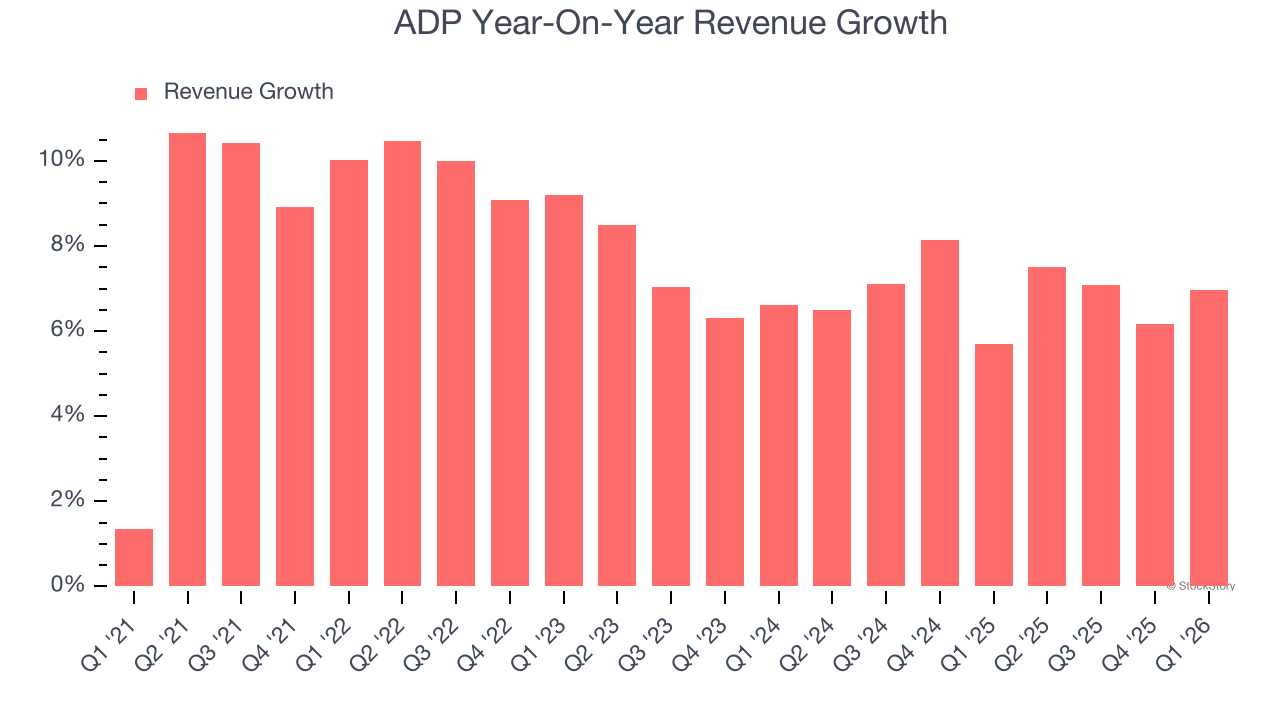
This quarter, ADP reported year-on-year revenue growth of 7%, and its $5.94 billion of revenue exceeded Wall Street’s estimates by 1.5%.
Looking ahead, sell-side analysts expect revenue to grow 5.3% over the next 12 months, a slight deceleration versus the last two years. We still think its growth trajectory is satisfactory given its scale and indicates the market sees success for its products and services.
ALSO WORTH WATCHING: Nvidia’s Quiet Partner. Nvidia’s chips cost a hundred grand. The connectors that make them work cost even more. One company makes them all.
Every AI server needs specialized infrastructure the chip companies don’t make. High-speed cables. Power connectors. Thermal sensors. This 90-year-old company built a monopoly on it. The AI boom just started. This stock is still flying under the radar. Claim The Stock Ticker Here for FREE.
Adjusted Operating Margin
Adjusted operating margin is a key measure of profitability. Think of it as net income (the bottom line) excluding the impact of non-recurring expenses, taxes, and interest on debt - metrics less connected to business fundamentals.
ADP has been a well-oiled machine over the last five years. It demonstrated elite profitability for a business services business, boasting an average adjusted operating margin of 25.3%.
Looking at the trend in its profitability, ADP’s adjusted operating margin rose by 3.7 percentage points over the last five years, as its sales growth gave it operating leverage.
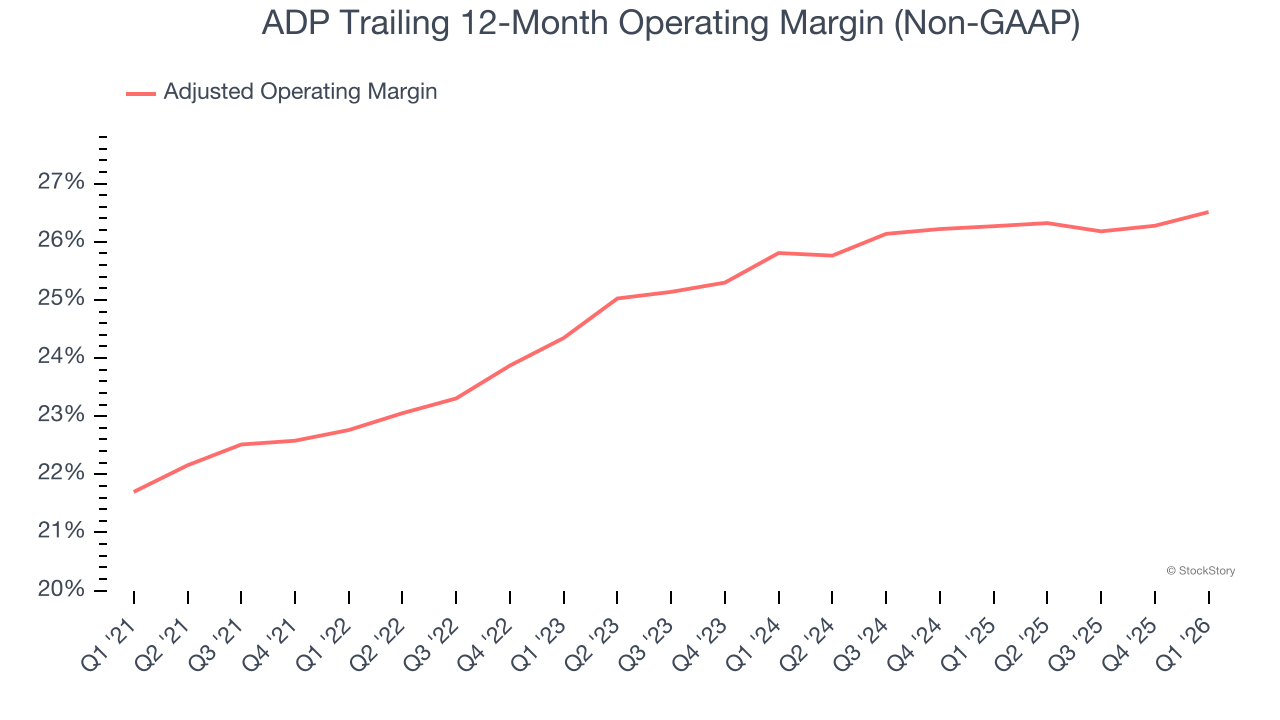
This quarter, ADP generated an adjusted operating margin profit margin of 30.1%, in line with the same quarter last year. This indicates the company’s overall cost structure has been relatively stable.
Earnings Per Share
We track the long-term change in earnings per share (EPS) for the same reason as long-term revenue growth. Compared to revenue, however, EPS highlights whether a company’s growth is profitable.
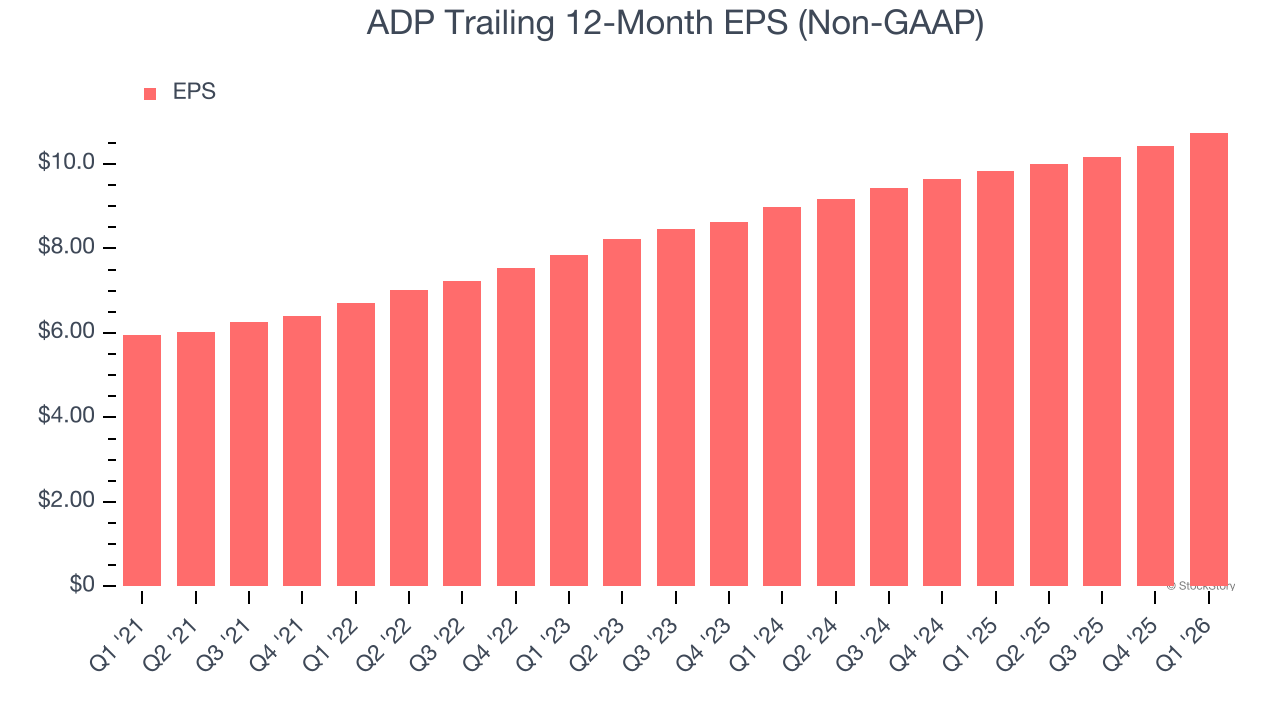
ADP’s EPS grew at 12.5% compounded annual growth rate over the last five years, higher than its 8.1% annualized revenue growth. This tells us the company became more profitable on a per-share basis as it expanded.
Diving into the nuances of ADP’s earnings can give us a better understanding of its performance. As we mentioned earlier, ADP’s adjusted operating margin was flat this quarter but expanded by 3.7 percentage points over the last five years. On top of that, its share count shrank by 5.9%. These are positive signs for shareholders because improving profitability and share buybacks turbocharge EPS growth relative to revenue growth. 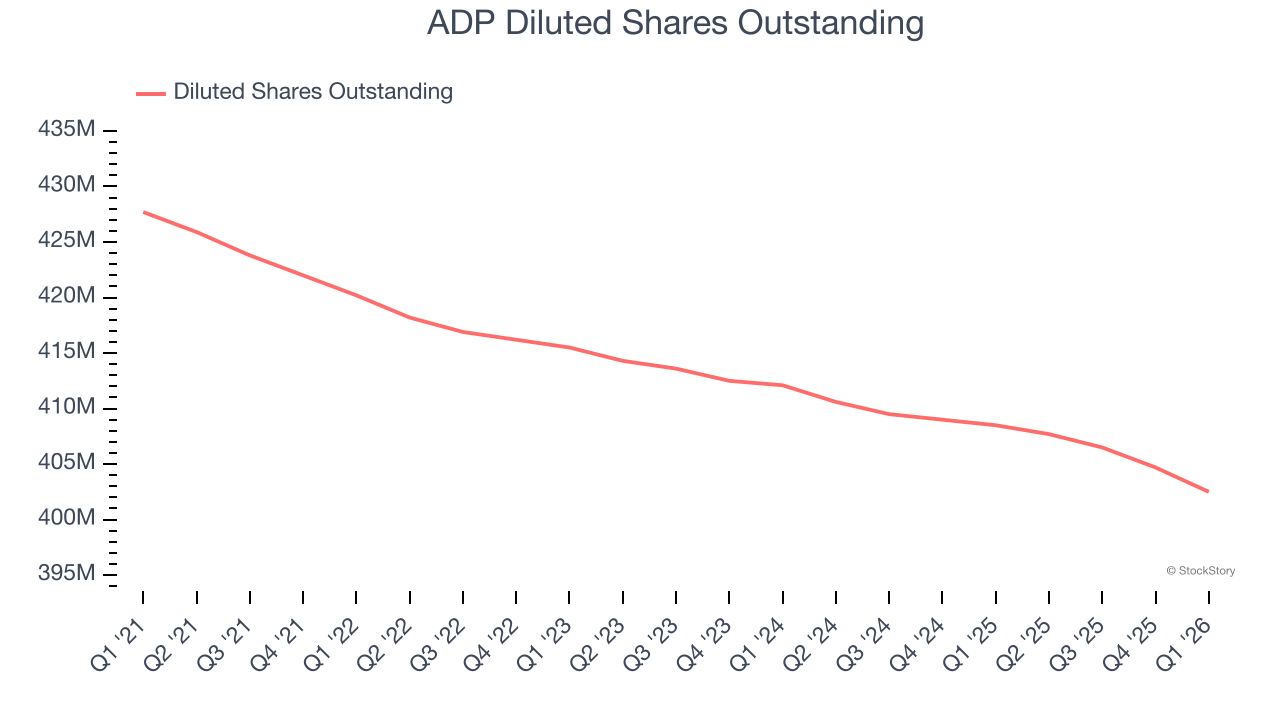
Like with revenue, we analyze EPS over a more recent period because it can provide insight into an emerging theme or development for the business.
For ADP, its two-year annual EPS growth of 9.4% was lower than its five-year trend. This wasn’t great, but at least the company was successful in other measures of financial health.
In Q1, ADP reported adjusted EPS of $3.37, up from $3.06 in the same quarter last year. This print beat analysts’ estimates by 2.3%. Over the next 12 months, Wall Street expects ADP’s full-year EPS of $10.74 to grow 9.5%.
Key Takeaways from ADP’s Q1 Results
It was good to see ADP narrowly top analysts’ revenue expectations this quarter. We were also glad its EPS outperformed Wall Street’s estimates. Overall, this print had some key positives. The stock traded up 3.7% to $206.50 immediately following the results.
Sure, ADP had a solid quarter, but if we look at the bigger picture, is this stock a buy? If you’re making that decision, you should consider the bigger picture of valuation, business qualities, as well as the latest earnings. We cover that in our actionable full research report which you can read here (it’s free).
/Intuit%20Inc%20logo-by%20Mojahid%20Mottakin%20via%20Shutterstock.jpg)


/Amazon%20pickup%20%26%20returns%20building%20by%20Bryan%20Angelo%20via%20Unsplash.jpg)