The information and opinions expressed below are based on my analysis of price behavior and chart activity
If you like what you’re reading here and would like to see more like this from Walsh Trading, please Click here and sign up for our daily futures market email.
Thursday, April 23, 2026
July Soybeans (Daily)
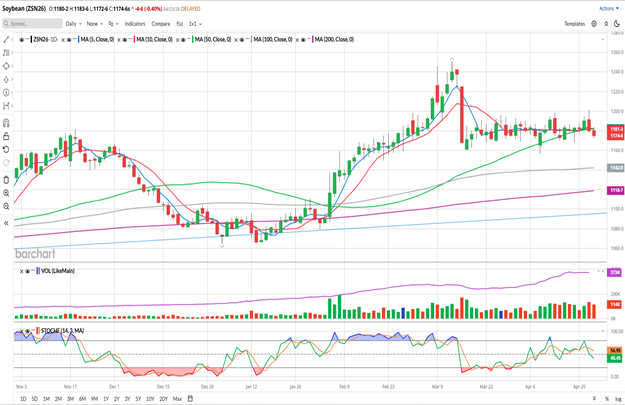
Today, July Soybeans closed at 11.74 ¾, dropping 4 ¾ cents on the day. This marks the lowest close since April 15th. Yesterday, the market spiked all the way up to 12.01 ¼, but a wave of selling pressure hit the market and the day ended with a bearish engulfment. That was the 2nd attempt by the market at the 12.00 level in the past 2 weeks. On the 13th, the high was at 11.99.
You may notice a few things by looking at the chart above. First off, since the limit down day on March 16th, this market has basically been a flat line. The 5- and 10- day moving averages (blue/red) have been very directionless for the past month or so and the market has traded on both sides. The short-term trend has been flat, which I think is rather unusual for the Soybean market. Today, those averages are at 11.81 ¾ and 11.81 ½, respectively. They are currently in a “bullish” configuration, by only 1 tick. Wednesday’s and Thursday’s trade posted 2 consecutive closes below the 50-day average (green, 11.82 ¼) which is the first time that’s happened since the market broke above that in January. The 100- (grey) and 200-day (purple) are well below the market, offering potential support, with the closest being at 11.42. They are both still inclined higher. Stochastics (bottom sub-graph) are mid-range and pointing lower. To my eye, that indicator hasn’t been much since it turned out of the overbought status in March.
I know that many traders have been focused on the potential meeting between Trump/Xi that could spark a demand rally, should the Chinese agree to purchase more US Soybeans. I’m a bit skeptical of that, for a few reasons. The meeting has been pushed back and tentatively rescheduled several times, and it’s very unclear if the May meeting is set in stone. I think the war/conflict with Iran will have a great deal of impact, both on the timing of the meet up and the subjects of discussion. China has also spent a great deal of capital over the past few years, shoring up the Brazilian infrastructure in order to ensure that they have a stable supply vendor, should relations with the US break down. And Brazil is putting the finishing touches on another record Bean harvest, in excess of 178 million metric tons. I’m of the opinion that the Chinese will likely buy Beans from Brazil, rather than the US. A diplomatic agreement may change that, but I don’t see one coming anytime soon.
The Bean market has been in a sideways pattern for quite some time now. It’s tried to break out to the upside and has, so far, failed. Without a new bullish impetus, the path of least resistance is almost always down. It’s also possible that it stays in this range and continues it’s recent whipsaw trade, frustrating all of the trend-followers out there.
July Soybeans (Weekly)
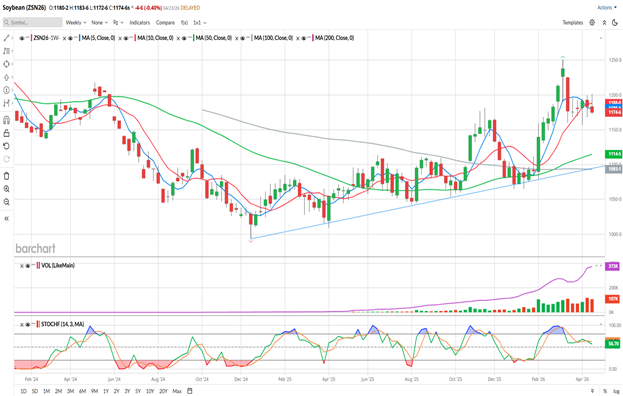
So far this week, July Beans are down 8 ¼ cents. Not a huge move for Soybeans, I think. However, the 5- and 10-week moving averages (blue/red) did make a bearish crossover with last week’s trade, reversing the bullish signal they gave in early February. Those averages are at 11.80 ¾ and 11.88, respectively, offering potential resistance. If the week ended today, this would mark the lowest weekly close since the last week in February. The 50- and 100-week averages are in a bullish configuration, having made a bullish crossover during the first week of March. The nearest is the 50-week (green) near 11.14 ½, offering potential support. You may notice the blue trendline drawn on the weekly chart, that also corresponds with the 100-week average, near 10.93. The trendline shows us that the overall trend is still up, but seems to have lots of room to retrace. Stochastics (bottom sub-graph) are above mid-range and pointing lower.
According to last Friday’s Commitment of Traders report, managed money was holding a net long position of 175,000 contract. They did reduce some of those longs last week, but if a full-blown “fund liquidation” occurs I would expect a somewhat aggressive pullback in prices.
Aggressive and well-margined traders may do well to consider establishing short futures positions in July Soybeans. Perhaps a Sell order at/near Wednesday’s low of 11.78 would work for you. I would suggest a 15 cent Buy Stop, risking $750 per contract, before your commissions/fees. A profit target near the 200-day average, at 11.18 would result in a gain of $3,000 per contract, before your commissions/fees.
Less aggressive traders, or those that prefer options, may do well to consider July Put Options. Those options expire in 64 days. 11.50 Puts settled at 18 1/8 today, or $906.25 per option out-of-pocket, before your commissions/fees. I would suggest a GTC order to take a profit at 2x what you pay for the options. I wouldn’t necessarily recommend a stop order in the options, rather, set a price alert and consider exiting those Puts if the trade at ½ of what you’ve paid out.
If you like what you’ve read here and would like to see more like this from Walsh Trading, please Click here and sign up for our daily futures market email.
Jefferson Fosse Walsh Trading
Direct 312 957 8248 Toll Free 800 556 9411
jfosse@walshtrading.com www.walshtrading.com
Walsh Trading, Inc. is registered as a Guaranteed Introducing Broker with the Commodity Futures Trading Commission and an NFA Member.
Futures and options trading involves substantial risk and is not suitable for all investors. Therefore, individuals should carefully consider their financial condition in deciding whether to trade. Option traders should be aware that the exercise of a long option will result in a futures position. The valuation of futures and options may fluctuate, and as a result, clients may lose more than their original investment. The information contained on this site is the opinion of the writer or was obtained from sources cited within the commentary. The impact on market prices due to seasonal or market cycles and current news events may already be reflected in market prices. PAST PERFORMANCE IS NOT NECESSARILY INDICATIVE OF FUTURE RESULTS. All information, communications, publications, and reports, including this specific material, used and distributed by Walsh Trading, Inc. (“WTI”) shall be construed as a solicitation for entering into a derivatives transaction. WTI does not distribute research reports, employ research analysts, or maintain a research department as defined in CFTC Regulation 1.71.
/Advanced%20Micro%20Devices%20Inc_%20office%20sign-by%20Poetra_RH%20via%20Shutterstock.jpg)
/Chipset%20held%20over%20rush%20hour%20traffic%20by%20Jae%20Young%20Ju%20via%20iStock.jpg)


/The%20sign%20for%20Marvell%20Technology%20out%20front%20of%20a%20corporate%20office%20by%20Valeriya%20Zankovych%20via%20Shutterstock.jpg)