- Despite the constant yelling, gnashing of teeth, and rending of garments over higher interest rates, US stock indexes remain in long-term uptrends.
- That being said, both the S&P 500 and Nasdaq look to have Wave 1 peaks on their respective monthly charts during February.
- the Dow Jones Industrial Average posted its Wave 1 peak during December, with all three likely to see sold Wave 2 selloffs over the coming months.
There are times I think I should’ve been a market reporter or talking head. If so, you have to know only one phrase and you can write and or talk endlessly and never be questioned. When covering grains and oilseeds all one has to do is start each piece or segment with, “The market did this because USDA said that…”. It’s like shooting fish in a barrel as folks will click to read it as quickly as possible. If you’ve been following along with financial media the last number of months (year?), the rabble yell goes something like this, “Stock markets are down because of interest rate fears!”. On those days, weeks, and months when stock markets rally the hue and cry is along the lines of, “Stock markets are up, ignoring interest rate fears!!” Again, I chose the wrong line of work. Or maybe not.
Since we’ve turned another calendar page forward, I want to take an updated look at the three major US stock markets. As I’ve talked about in the past, all three completed bullish long-term reversal patterns on their respective monthly charts last October, bringing an end to previous downtrends roughly 10 months earlier than expected. Now that we’ve moved into meteorological spring, one of the most frequently asked questions is if the grain and oilseed sector will pull investment money away from equities. Given the move to long-term uptrends in US stock markets, and weather patterns seemingly changing for global grain production, I’m going to continue to say ‘no’ for now. But like the weather, this could change quickly. I know this opens the door to talk about the problems with CFTC Commitments of Traders reports, but that’s a discussion for another day.
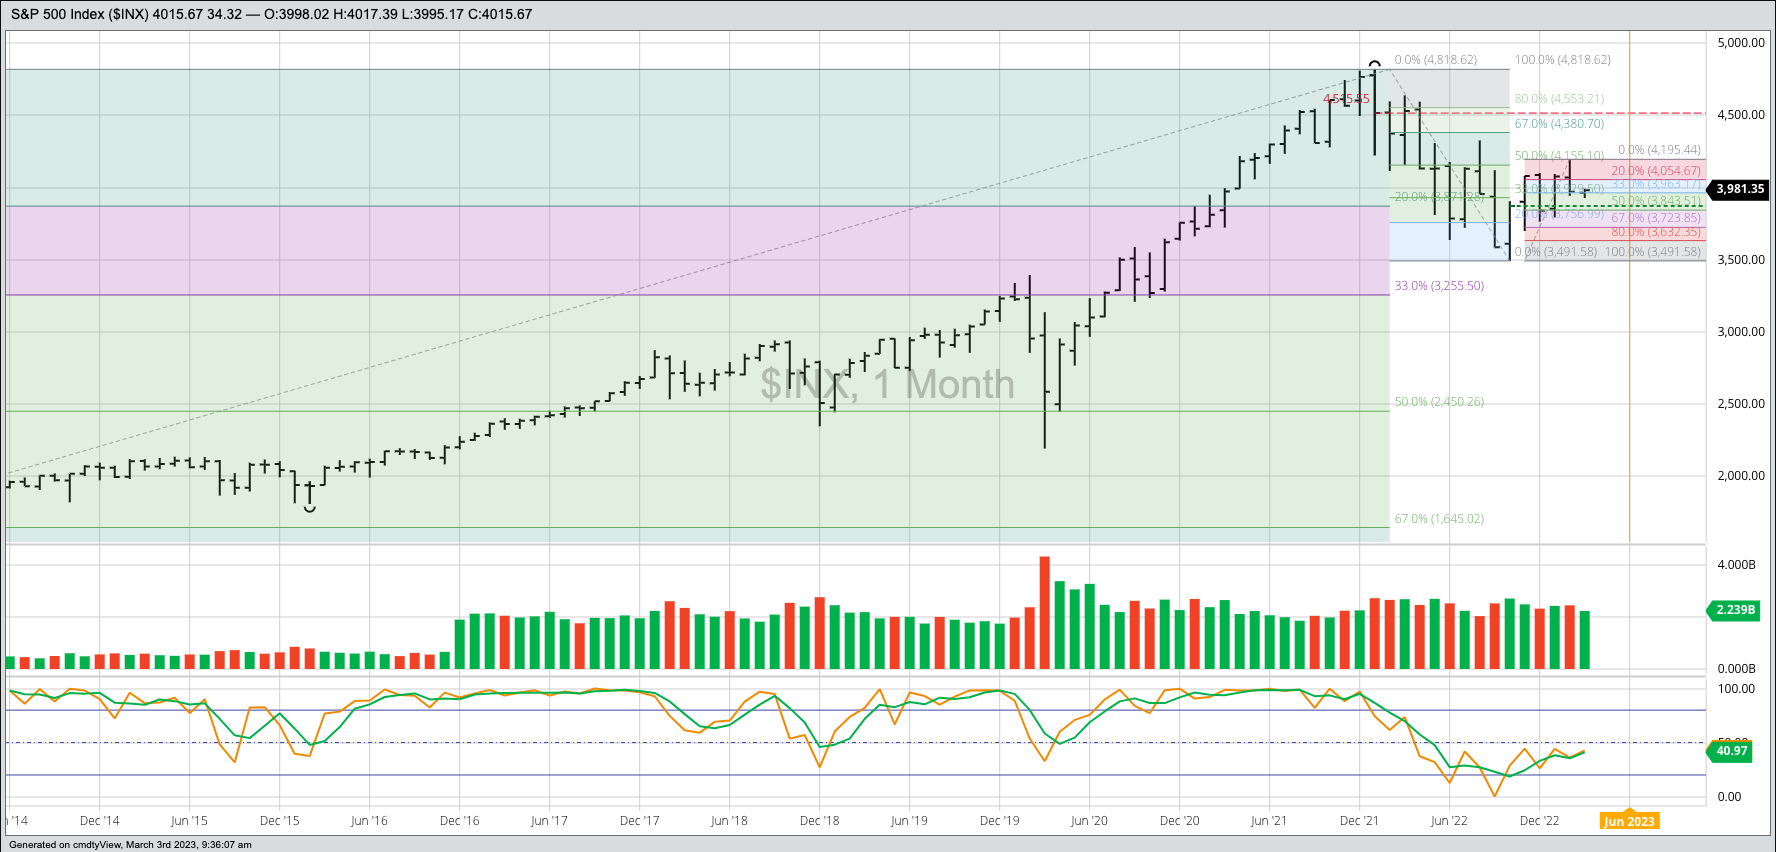
The S&P 500 ($INX) posted a high of 4,195.44 during February before falling to a monthly low of 3,943.08 and closing at 3,970.15, down 106.45 from January’s settlement. This completed a bearish spike reversal but given how early the market is in in its new long-term uptrend I see this as a Wave 1 (of an Elliott Wave 5-wave uptrend pattern) peak. If so, then it’s not unusual for Wave 2 to retrace most of Wave 1 before bottoming out. Given Wave 1 ran from 3,491.58 (October 2022 low) through the January high, an 80% retracement puts the Wave 2 target near 3,632.35. That’s a steep selloff, and bearish analysts and pundits would likely be thumping their chest and shouting, “See, I told you so. Interest rates!”. But the reality is it doesn’t change anything about the long-term trend of the market. In fact, if we see a Benjamin Franklin Fish Similarity[i] play out it would put the $INX closer to the June timeframe of an expected bullish turn.
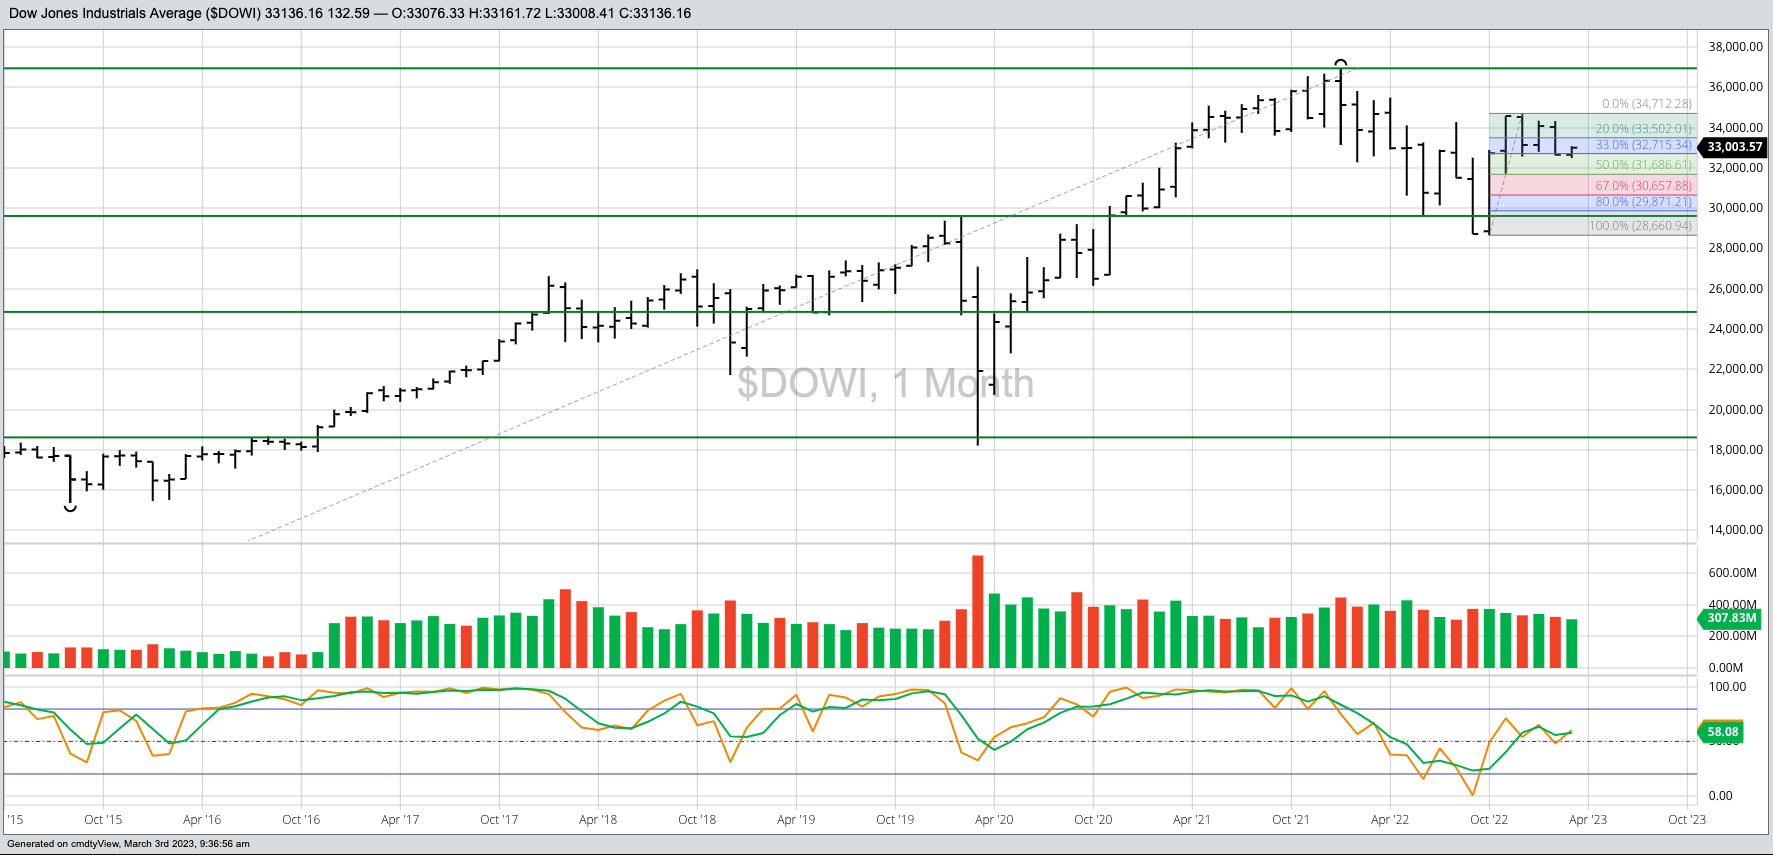
I see something similar on the long-term monthly chart for the Dow Jones Industrial Average ($DOWI). Here, though, the initial reversal was of the key type[ii], a much more reliable reversal pattern in my technical analyst view. From its October low of 28,660.94 the $DOWI rallied to a December high of 34,712.28, with the latter month showing a completed bearish spike reversal. This again looks to be a Wave 1 peak, setting the stage for the Wave 2 selloff we’ve seen. As with the $INX, it’s possible the $DOWI could retrace 80% of Wave 1 putting the Wave 2 target at 29,871.21. This would make many of the talking heads happy as they continue to yell about a possible 15% selloff. Okay, that’s like folks who get excited about NASS’ Crop Progress reports, 15% of what? If we take it off the December high mark it means the $DOWI could fall to about 29,500, or roughly the 80% retracement fitting with Wave 2 of the uptrend.
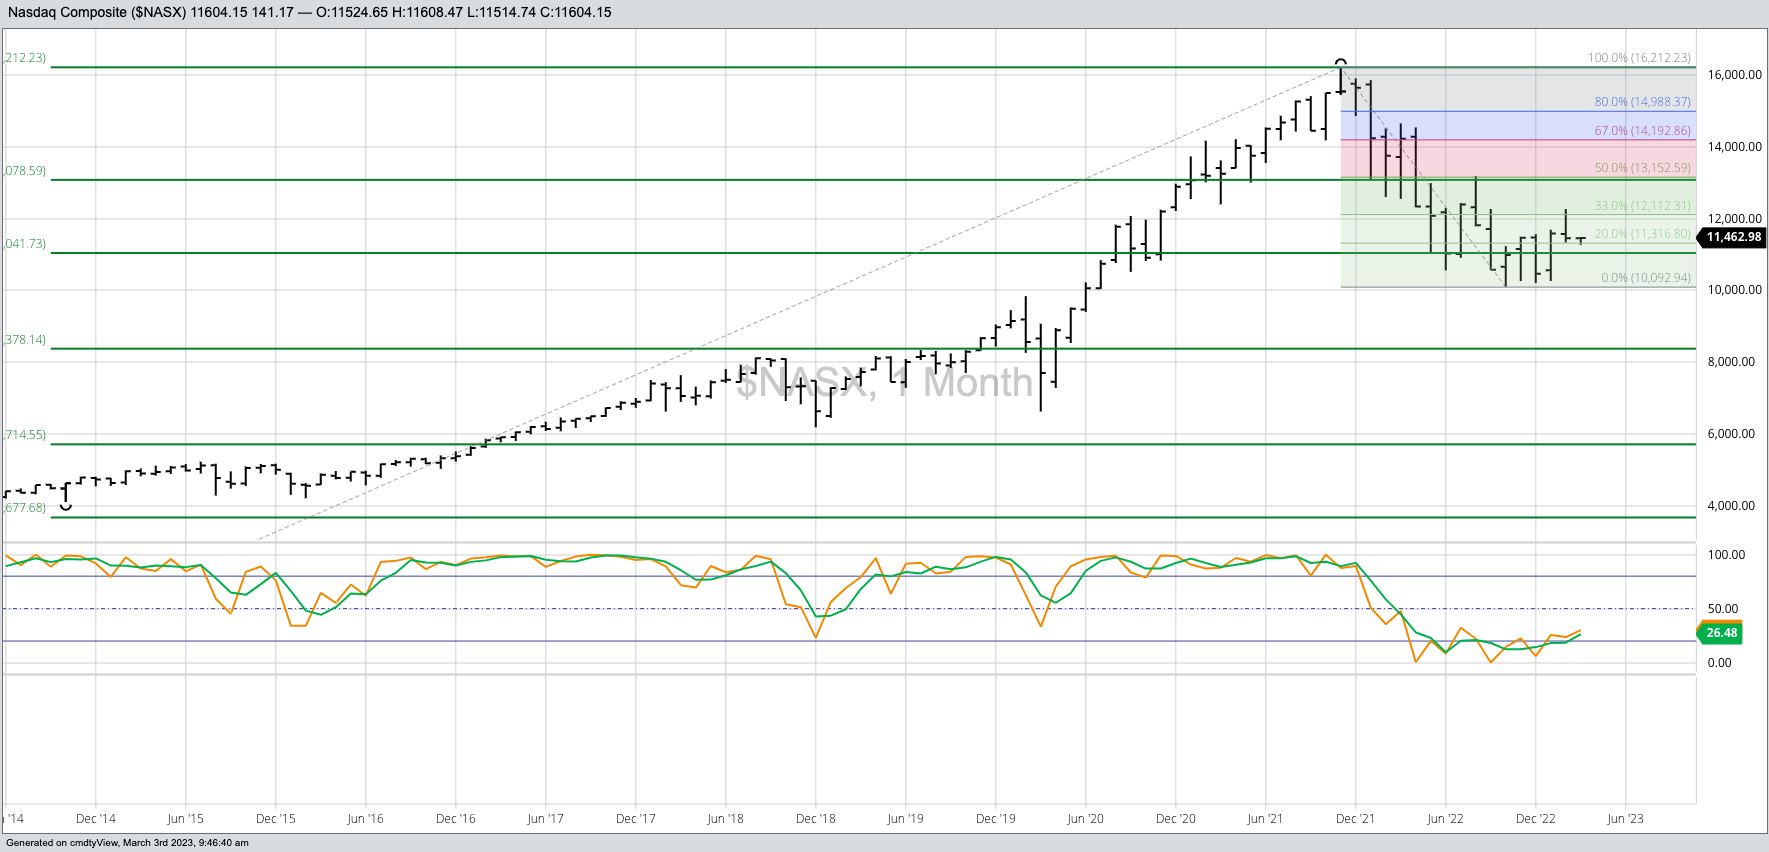
The Nasdaq ($NASX) is also similar, but different. Here the monthly chart shows a much choppier Wave 1, with the argument possibly being made the December selloff was actually an early Wave 2. I’m not going to put myself in that camp, at least not yet. What grabs my attention with this chart is the $NASX jumping to a new 4-month high of 12,269.55 during February before closing the month at 11,455.54, down 129.01 for the month. This means both the $NASX and $INX gave us bullish breakouts and bearish spike reversals during the shortest month of the year. I know tech stocks could continue to face a headwind in 2023, and it stands out to me the early stages of the new long-term uptrend of the $NASX has recovered the smallest percentage of its previous downtrend, but I’m going to stick with the idea the index will go higher over time.
Despite the “Interest Rate Fears” rabble yell.
[i] A Benjamin Franklin Fish Similarity tells us “Like guests and fish, a market starts to stink after three days (weeks, months, whatever timeframe is being studied) of moving against the trend”.
[ii] A key bullish reversal is when a market falls to a new low before rallying to take out the previous period’s high and then closes higher for whatever period is being studied.
More Stock Market News from Barchart
- Markets Today: Stock Indexes Climb as Global Bond Yields Fall
- Consumer Discretionary Stocks to Watch In a Hot Jobs Market
- 3 Options Strategies For Fedex Earnings
- Stock Index Futures Move Higher As Dovish Fed Comments Boost Hopes Of Fed Pivot
On the date of publication, Darin Newsom did not have (either directly or indirectly) positions in any of the securities mentioned in this article. All information and data in this article is solely for informational purposes. For more information please view the Barchart Disclosure Policy here.

/An%20Intel%20sign%20out%20front%20of%20a%20corporate%20office%20by%20wolterke%20via%20Adobe%20Stock.jpeg)
/Alibaba%20by%20testing%20via%20Shutterstock.jpg)
/Alphabet%20(Google)%20Image%20by%20Markus%20Mainka%20via%20Shutterstock.jpg)